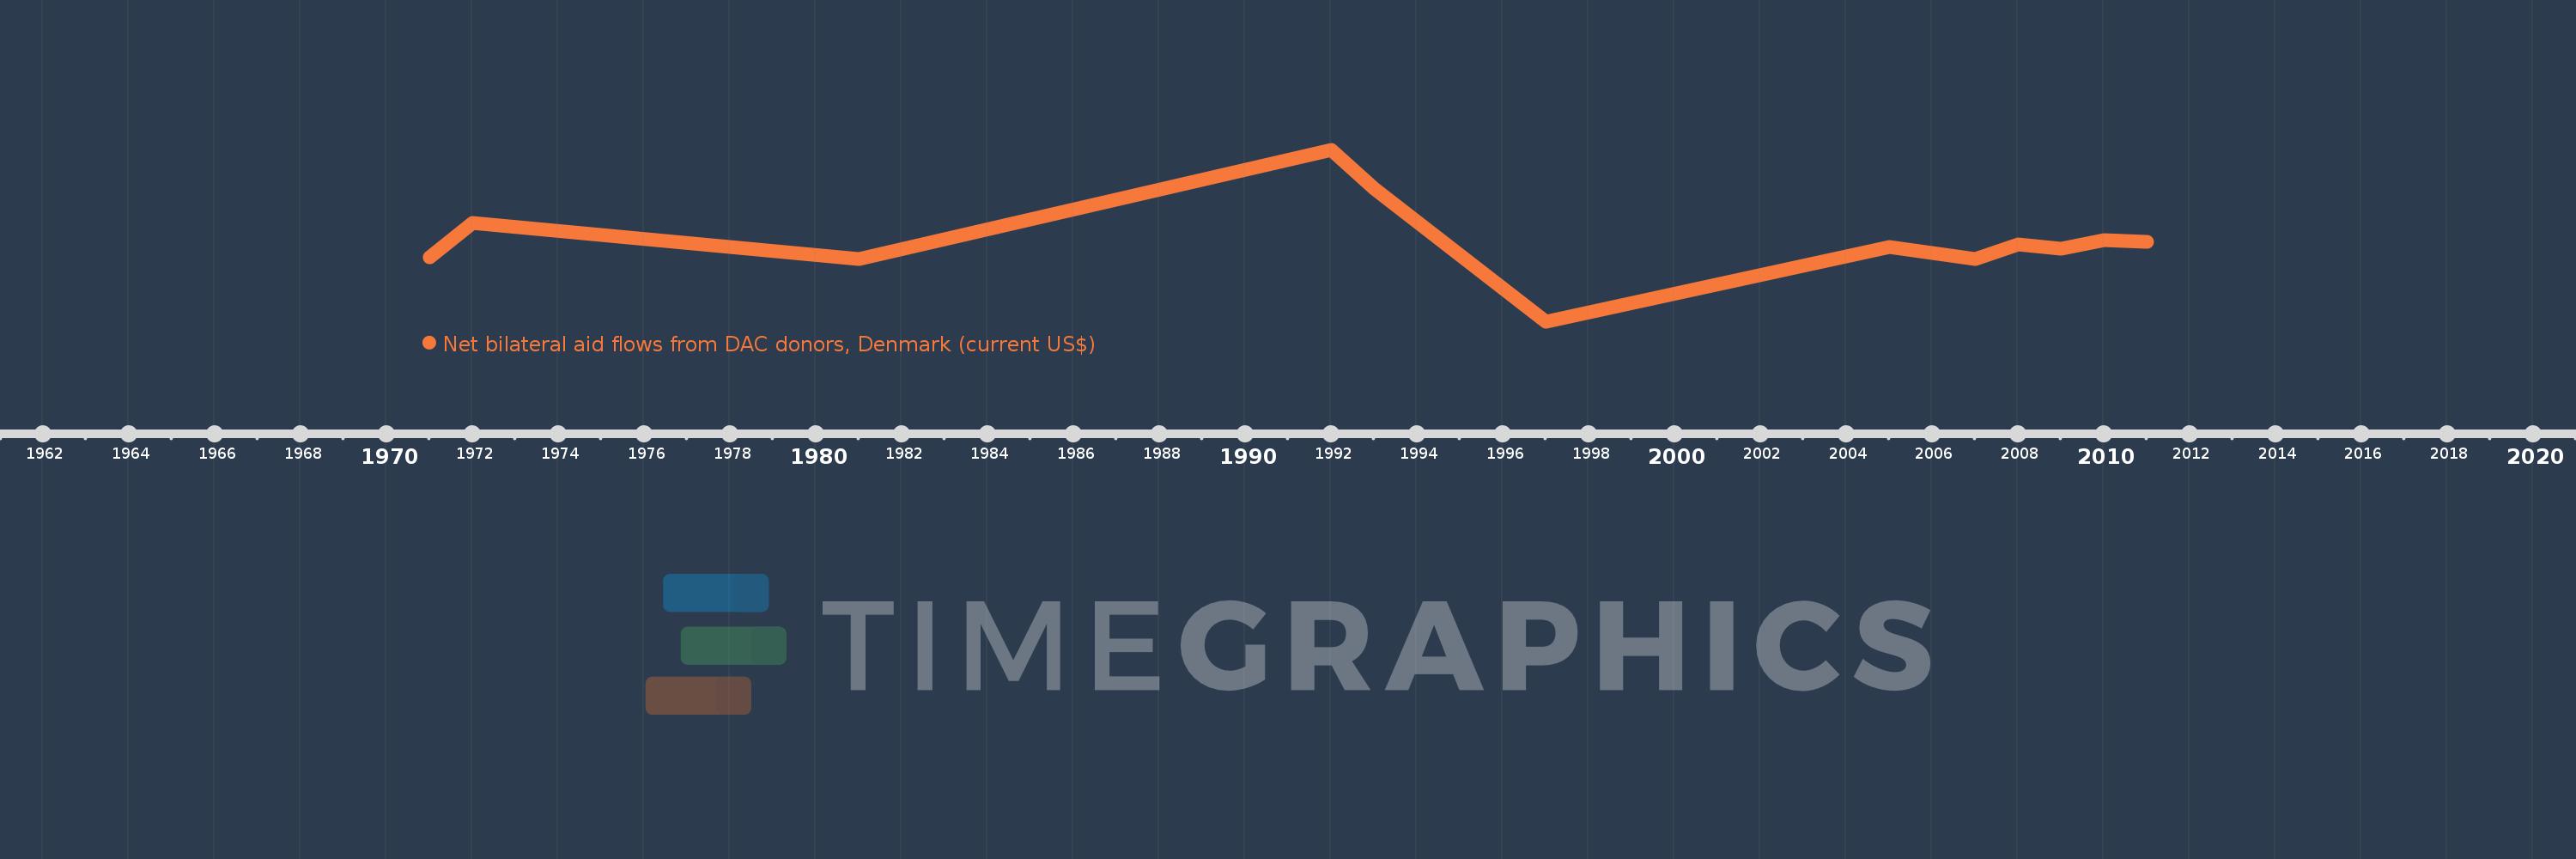
This timeline shows a graph from 1971 to 2011 of Paraguay. No data until 1970. Number of actual observations by date: 12.
Source name:
World Development Indicators
Source organization:
Development Assistance Committee of the Organisation for Economic Co-operation and Development, Geographical Distribution of Financial Flows to Developing Countries, Development Co-operation Report, and International Development Statistics database. Data are available online at: www.oecd.org/dac/stats/idsonline.
Categories, topics:
Aid Effectiveness
Last updated:
apr 23, 2017
Indicators value changes by year
Meaning:
162.5K
Minimum:
-500.0K
jan 1, 1997
Maximum:
890.0K
jan 1, 1992
At the date of observation
Value
Absolute change
Change from the previous value
jan 1, 1971
20.0K
+20.0K
0.0%
jan 1, 1972
300.0K
+280.0K
1.4K%
jan 1, 1981
10.0K
-290.0K
-96.67%
jan 1, 1992
890.0K
+880.0K
8.8K%
jan 1, 1993
580.0K
-310.0K
-34.83%
jan 1, 1997
-500.0K
-1.08 mln
-186.21%
jan 1, 2005
110.0K
+610.0K
-122.0%
jan 1, 2007
10.0K
-100.0K
-90.91%
jan 1, 2008
130.0K
+120.0K
1.2K%
jan 1, 2009
90.0K
-40.0K
-30.77%
jan 1, 2010
160.0K
+70.0K
77.78%
jan 1, 2011
150.0K
-10.0K
-6.25%
Ranking of countries by current statistics by years