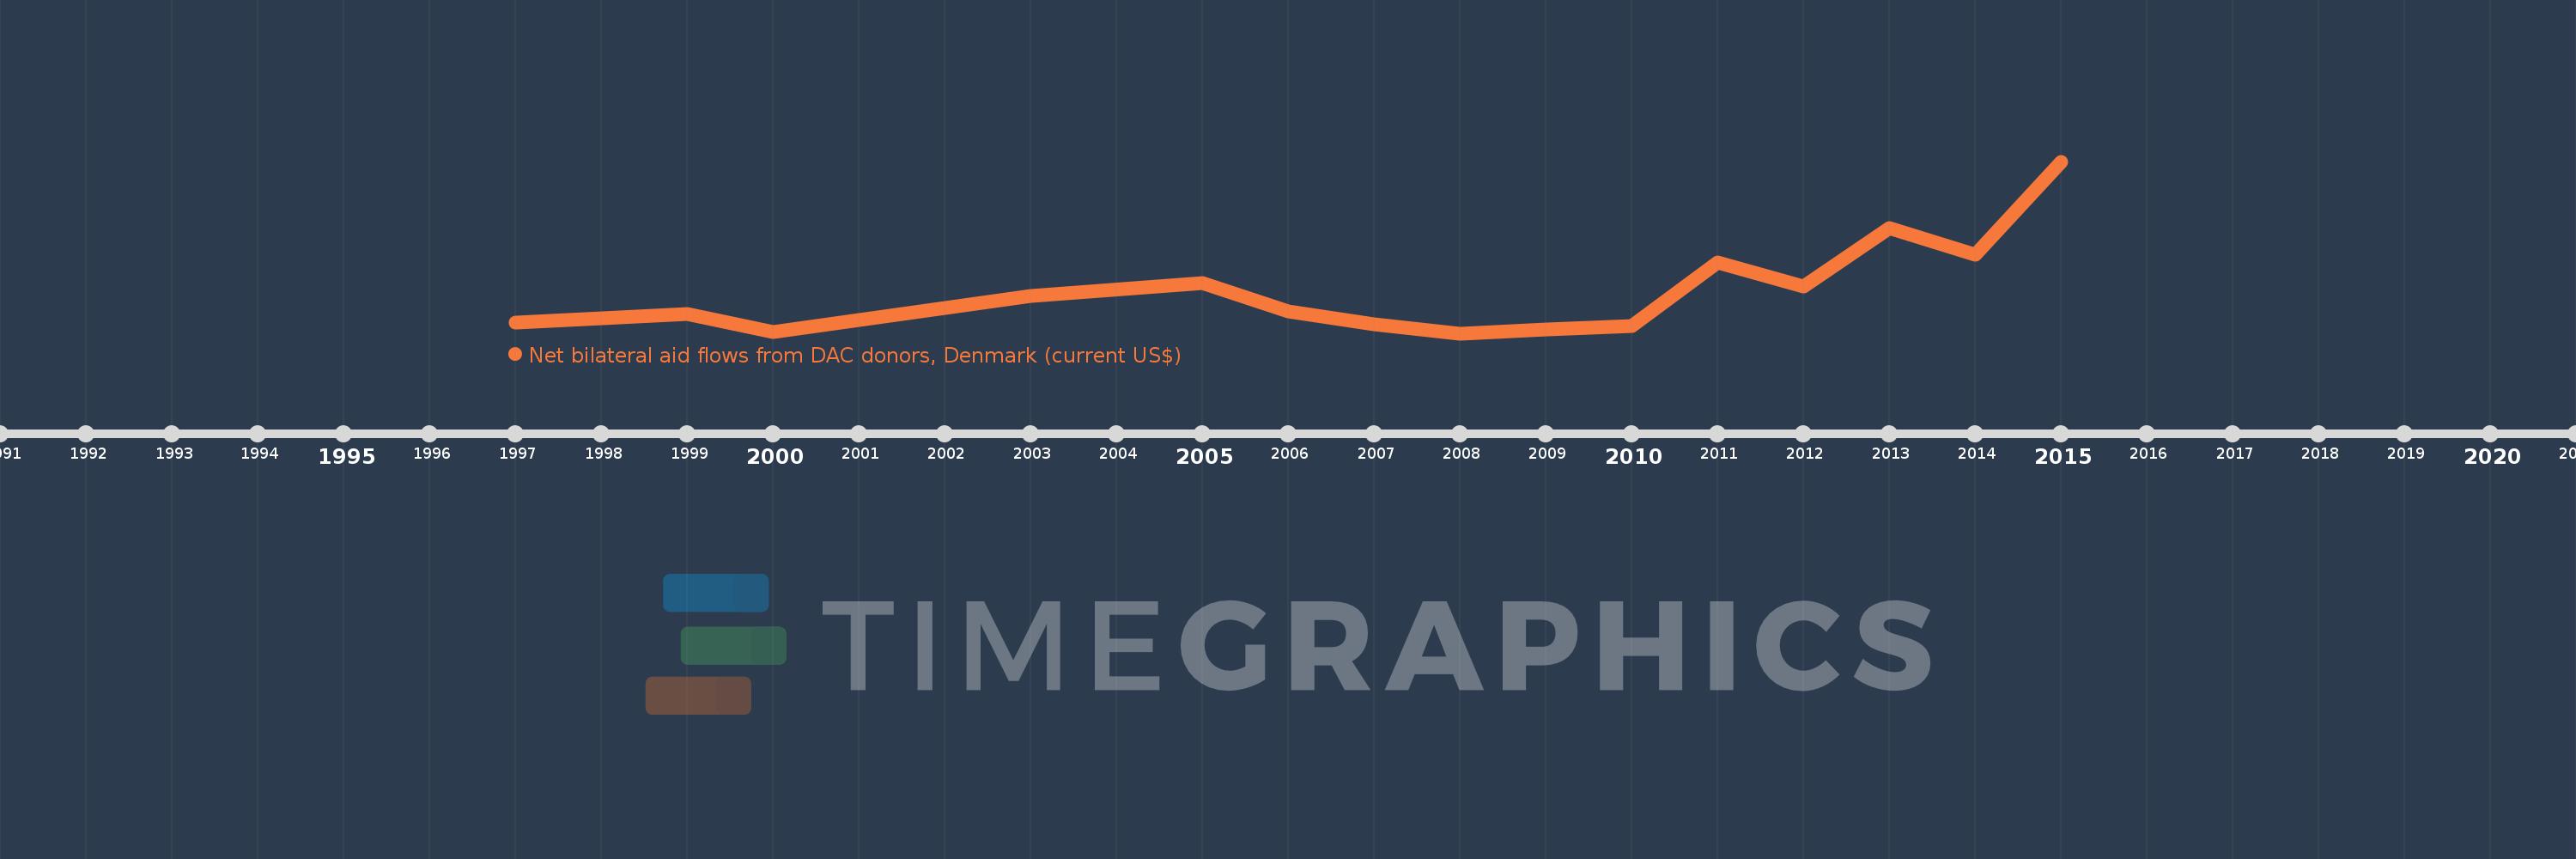
This timeline shows a graph from 1997 to 2015 of Moldova. No data until 1996. Number of actual observations by date: 15.
Source name:
World Development Indicators
Source organization:
Development Assistance Committee of the Organisation for Economic Co-operation and Development, Geographical Distribution of Financial Flows to Developing Countries, Development Co-operation Report, and International Development Statistics database. Data are available online at: www.oecd.org/dac/stats/idsonline.
Categories, topics:
Aid Effectiveness
Last updated:
apr 23, 2017
Indicators value changes by year
Meaning:
1.644 mln
Minimum:
80.0K
jan 1, 2008
Maximum:
6.44 mln
jan 1, 2015
At the date of observation
Value
Absolute change
Change from the previous value
jan 1, 1997
470.0K
+470.0K
0.0%
jan 1, 1999
810.0K
+340.0K
72.34%
jan 1, 2000
140.0K
-670.0K
-82.72%
jan 1, 2003
1.47 mln
+1.33 mln
950.0%
jan 1, 2005
1.94 mln
+470.0K
31.97%
jan 1, 2006
900.0K
-1.04 mln
-53.61%
jan 1, 2007
410.0K
-490.0K
-54.44%
jan 1, 2008
80.0K
-330.0K
-80.49%
jan 1, 2009
210.0K
+130.0K
162.5%
jan 1, 2010
340.0K
+130.0K
61.9%
jan 1, 2011
2.69 mln
+2.35 mln
691.18%
jan 1, 2012
1.8 mln
-890.0K
-33.09%
jan 1, 2013
3.97 mln
+2.17 mln
120.56%
jan 1, 2014
2.99 mln
-980.0K
-24.69%
jan 1, 2015
6.44 mln
+3.45 mln
115.38%
Ranking of countries by current statistics by years