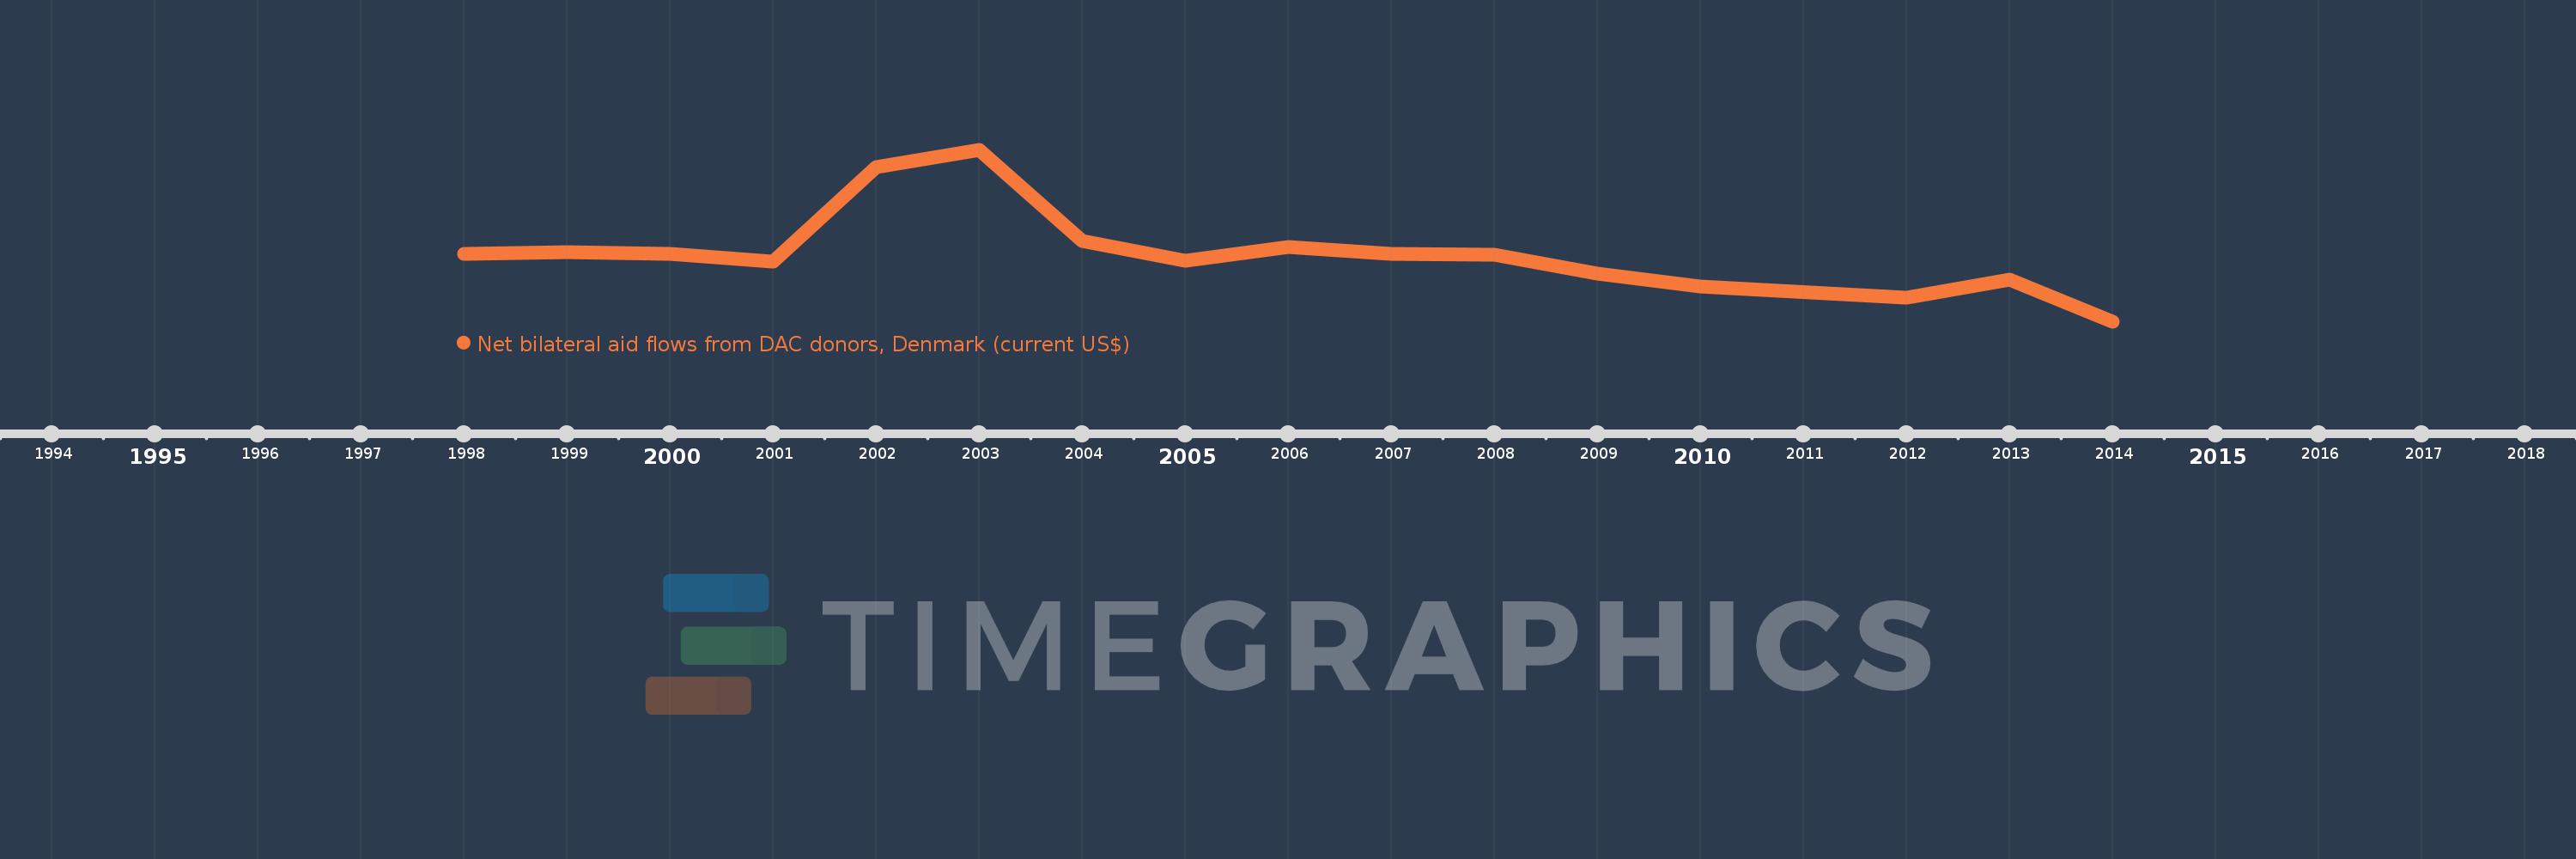
This timeline shows a graph from 1998 to 2014 of Panama. No data until 1997. Number of actual observations by date: 16.
Source name:
World Development Indicators
Source organization:
Development Assistance Committee of the Organisation for Economic Co-operation and Development, Geographical Distribution of Financial Flows to Developing Countries, Development Co-operation Report, and International Development Statistics database. Data are available online at: www.oecd.org/dac/stats/idsonline.
Categories, topics:
Aid Effectiveness
Last updated:
apr 23, 2017
Indicators value changes by year
Meaning:
193.125K
Minimum:
-980.0K
jan 1, 2014
Maximum:
1.96 mln
jan 1, 2003
At the date of observation
Value
Absolute change
Change from the previous value
jan 1, 1998
190.0K
+190.0K
0.0%
jan 1, 1999
220.0K
+30.0K
15.79%
jan 1, 2000
190.0K
-30.0K
-13.64%
jan 1, 2001
50.0K
-140.0K
-73.68%
jan 1, 2002
1.67 mln
+1.62 mln
3.24K%
jan 1, 2003
1.96 mln
+290.0K
17.37%
jan 1, 2004
400.0K
-1.56 mln
-79.59%
jan 1, 2005
70.0K
-330.0K
-82.5%
jan 1, 2006
300.0K
+230.0K
328.57%
jan 1, 2007
190.0K
-110.0K
-36.67%
jan 1, 2008
170.0K
-20.0K
-10.53%
jan 1, 2009
-150.0K
-320.0K
-188.24%
jan 1, 2010
-370.0K
-220.0K
146.67%
jan 1, 2012
-570.0K
-200.0K
54.05%
jan 1, 2013
-250.0K
+320.0K
-56.14%
jan 1, 2014
-980.0K
-730.0K
292.0%
Ranking of countries by current statistics by years