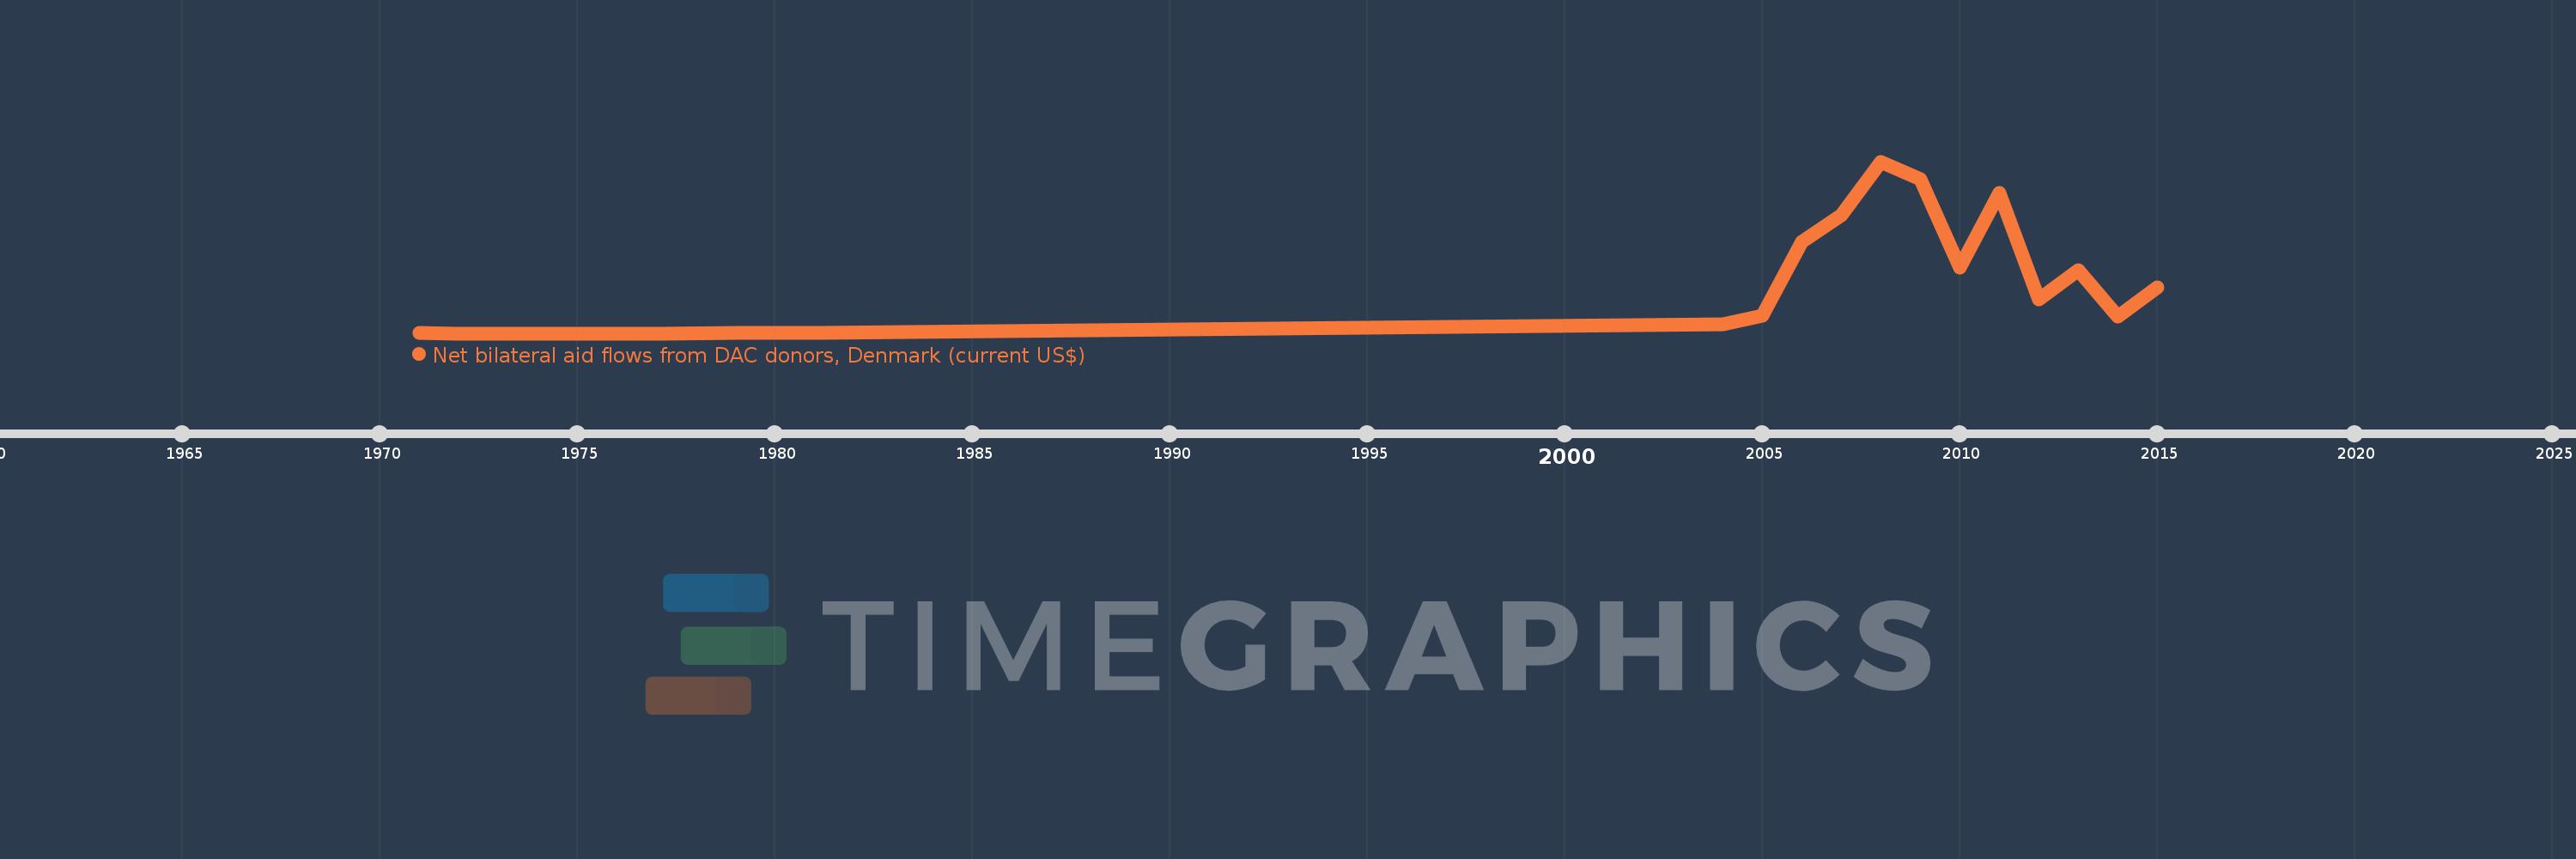
This timeline shows a graph from 1971 to 2015 of Iraq. No data until 1970. Number of actual observations by date: 19.
Source name:
World Development Indicators
Source organization:
Development Assistance Committee of the Organisation for Economic Co-operation and Development, Geographical Distribution of Financial Flows to Developing Countries, Development Co-operation Report, and International Development Statistics database. Data are available online at: www.oecd.org/dac/stats/idsonline.
Categories, topics:
Aid Effectiveness
Last updated:
apr 23, 2017
Indicators value changes by year
Meaning:
11.531 mln
Minimum:
10.0K
jan 1, 1972
Maximum:
40.53 mln
jan 1, 2008
At the date of observation
Value
Absolute change
Change from the previous value
jan 1, 1971
20.0K
+20.0K
0.0%
jan 1, 1972
10.0K
-10.0K
-50.0%
jan 1, 1976
10.0K
0.0
0.0%
jan 1, 1977
10.0K
0.0
0.0%
jan 1, 1979
30.0K
+20.0K
200.0%
jan 1, 1980
20.0K
-10.0K
-33.33%
jan 1, 1981
30.0K
+10.0K
50.0%
jan 1, 2004
2.08 mln
+2.05 mln
6.83K%
jan 1, 2005
4.12 mln
+2.04 mln
98.08%
jan 1, 2006
21.5 mln
+17.38 mln
421.84%
jan 1, 2007
27.82 mln
+6.32 mln
29.4%
jan 1, 2008
40.53 mln
+12.71 mln
45.69%
jan 1, 2009
36.43 mln
-4.1 mln
-10.12%
jan 1, 2010
15.43 mln
-21.0 mln
-57.64%
jan 1, 2011
33.2 mln
+17.77 mln
115.17%
jan 1, 2012
8.11 mln
-25.09 mln
-75.57%
jan 1, 2013
14.97 mln
+6.86 mln
84.59%
jan 1, 2014
3.99 mln
-10.98 mln
-73.35%
jan 1, 2015
10.77 mln
+6.78 mln
169.92%
Ranking of countries by current statistics by years