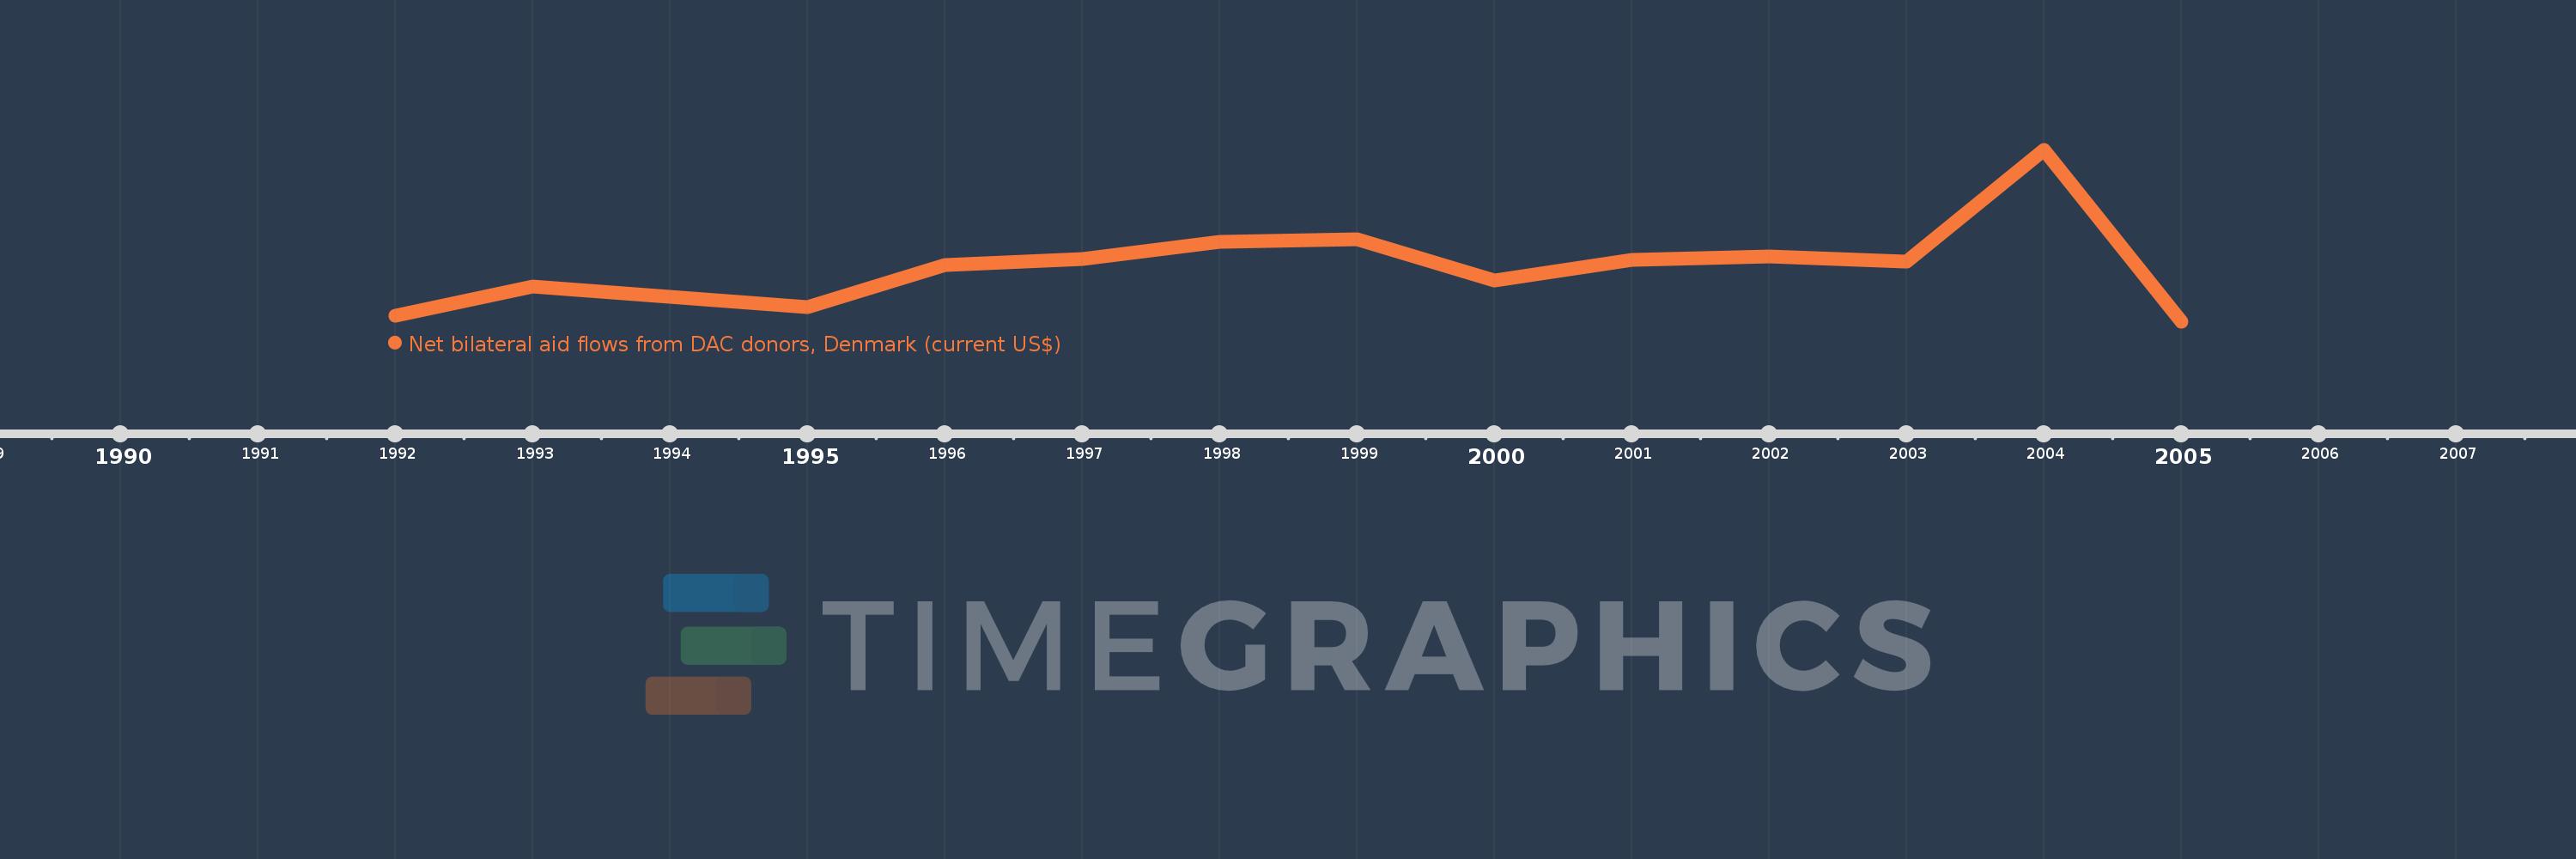
This timeline shows a graph from 1992 to 2005 of Russian Federation. No data until 1991. Number of actual observations by date: 13.
Source name:
World Development Indicators
Source organization:
Development Assistance Committee of the Organisation for Economic Co-operation and Development, Geographical Distribution of Financial Flows to Developing Countries, Development Co-operation Report, and International Development Statistics database. Data are available online at: www.oecd.org/dac/stats/idsonline.
Categories, topics:
Aid Effectiveness
Last updated:
apr 23, 2017
Indicators value changes by year
Meaning:
12.565 mln
Minimum:
690.0K
jan 1, 2005
Maximum:
36.48 mln
jan 1, 2004
At the date of observation
Value
Absolute change
Change from the previous value
jan 1, 1992
2.02 mln
+2.02 mln
0.0%
jan 1, 1993
8.09 mln
+6.07 mln
300.5%
jan 1, 1995
3.73 mln
-4.36 mln
-53.89%
jan 1, 1996
12.55 mln
+8.82 mln
236.46%
jan 1, 1997
13.84 mln
+1.29 mln
10.28%
jan 1, 1998
17.47 mln
+3.63 mln
26.23%
jan 1, 1999
17.89 mln
+420.0K
2.4%
jan 1, 2000
9.41 mln
-8.48 mln
-47.4%
jan 1, 2001
13.68 mln
+4.27 mln
45.38%
jan 1, 2002
14.29 mln
+610.0K
4.46%
jan 1, 2003
13.21 mln
-1.08 mln
-7.56%
jan 1, 2004
36.48 mln
+23.27 mln
176.15%
jan 1, 2005
690.0K
-35.79 mln
-98.11%
Ranking of countries by current statistics by years