33
/
AIzaSyB4mHJ5NPEv-XzF7P6NDYXjlkCWaeKw5bc
November 30, 2025
284954
Yemen, Rep.
YEM
true
2
1
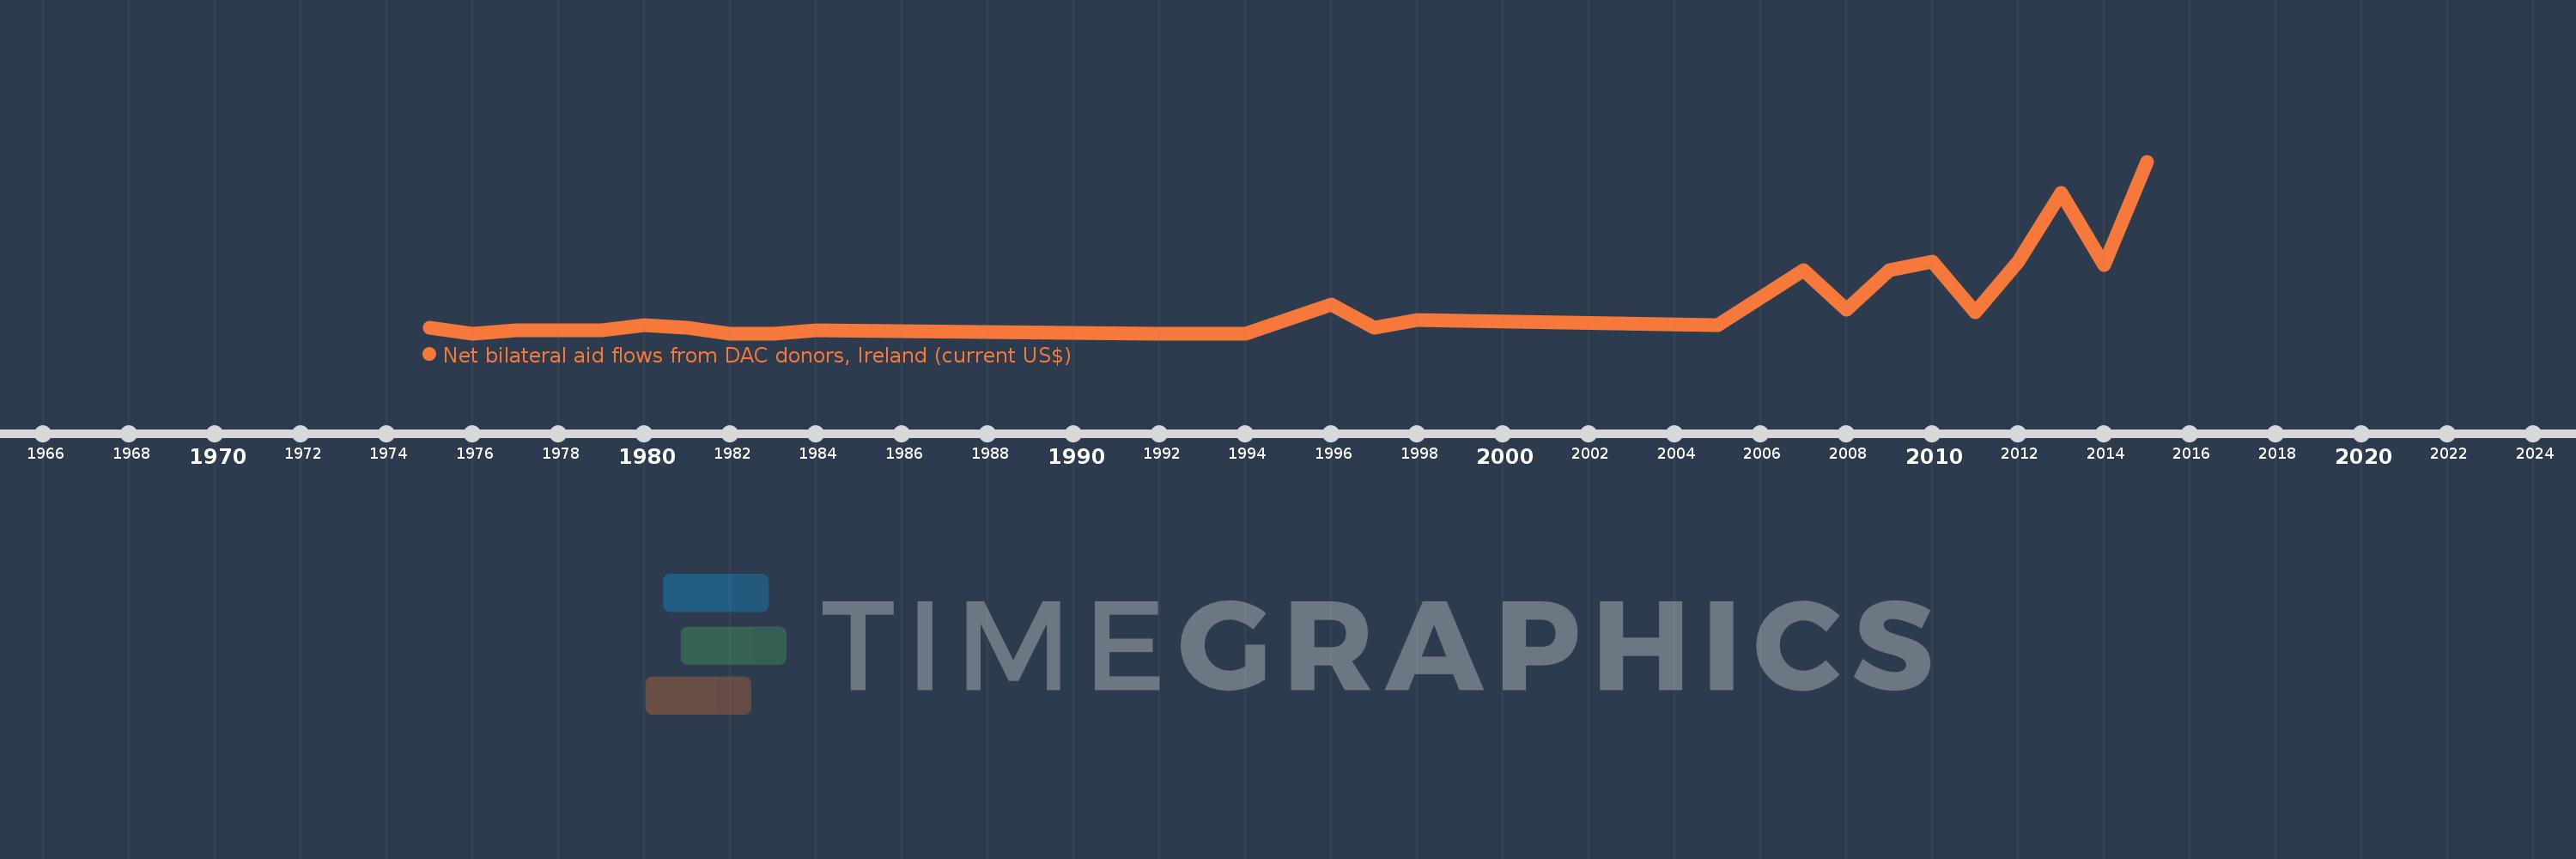
Net bilateral aid flows from DAC donors, Ireland (current US$)
2015,2014,2013,2012,2011,2010,2009,2008,2007,2005,1998,1997,1996,1994,1992,1984,1983,1982,1981,1980,1979,1978,1977,1976,1975