33
/
AIzaSyAYiBZKx7MnpbEhh9jyipgxe19OcubqV5w
May 1, 2025
245945
South Africa
ZAF
true
2
1
Net bilateral aid flows from DAC donors, Ireland (current US$)
2015,2014,2013,2012,2011,2010,2009,2008,2007,2006,2005,2004,2003,2002,2001,2000,1999,1998,1997,1996
Download
Global statistics library →South Africa →

Net bilateral aid flows from DAC donors, Ireland (current US$)

This statistics in other country:

AfghanistanAlbaniaAlgeriaAngolaArab WorldArgentinaArmeniaAzerbaijanBangladeshBelarusBelizeBeninBhutanBoliviaBosnia and HerzegovinaBotswanaBrazilBulgariaBurkina FasoBurundiCambodiaCameroonCaribbean small statesCentral African RepublicCentral Europe and the BalticsChadChileChinaColombiaComorosCongo, Dem. Rep.Congo, Rep.Costa RicaCote d'IvoireCroatiaCubaCzech RepublicDjiboutiDominican RepublicEast Asia & PacificEast Asia & Pacific (excluding high income)East Asia & Pacific (IDA & IBRD countries)EcuadorEgypt, Arab Rep.El SalvadorEquatorial GuineaEritreaEthiopiaEuro areaEurope & Central AsiaEurope & Central Asia (excluding high income)Europe & Central Asia (IDA & IBRD countries)European UnionFijiFragile and conflict affected situationsGabonGambia, TheGeorgiaGhanaGrenadaGuatemalaGuineaGuinea-BissauGuyanaHaitiHeavily indebted poor countries (HIPC)High incomeHondurasHong Kong SAR, ChinaHungaryIBRD onlyIDA & IBRD totalIDA blendIDA onlyIDA totalIndiaIndonesiaIran, Islamic Rep.IraqIsraelJamaicaJordanKazakhstanKenyaKorea, Dem. People’s Rep.Korea, Rep.KosovoKyrgyz RepublicLao PDRLatin America & Caribbean Latin America & Caribbean (excluding high income)Latin America & the Caribbean (IDA & IBRD countries)LatviaLeast developed countries: UN classificationLebanonLesothoLiberiaLibyaLithuaniaLow & middle incomeLow incomeLower middle incomeMacedonia, FYRMadagascarMalawiMalaysiaMaldivesMaliMauritaniaMauritiusMexicoMicronesia, Fed. Sts.Middle East & North AfricaMiddle East & North Africa (excluding high income)Middle East & North Africa (IDA & IBRD countries)Middle incomeMoldovaMongoliaMontenegroMoroccoMozambiqueMyanmarNamibiaNepalNicaraguaNigerNigeriaOECD membersOther small statesPacific island small statesPakistanPanamaPapua New GuineaParaguayPeruPhilippinesPolandRomaniaRussian FederationRwandaSamoaSao Tome and PrincipeSenegalSerbiaSeychellesSierra LeoneSlovak RepublicSloveniaSmall statesSolomon IslandsSomaliaSouth AfricaSouth AsiaSouth Asia (IDA & IBRD)South SudanSri LankaSt. LuciaSub-Saharan Africa Sub-Saharan Africa (excluding high income)Sub-Saharan Africa (IDA & IBRD countries)SudanSurinameSwazilandSyrian Arab RepublicTajikistanTanzaniaThailandTimor-LesteTogoTrinidad and TobagoTunisiaTurkeyTurkmenistanUgandaUkraineUpper middle incomeUruguayUzbekistanVanuatuVenezuela, RBVietnamWest Bank and GazaWorldYemen, Rep.ZambiaZimbabwe

Timeline:

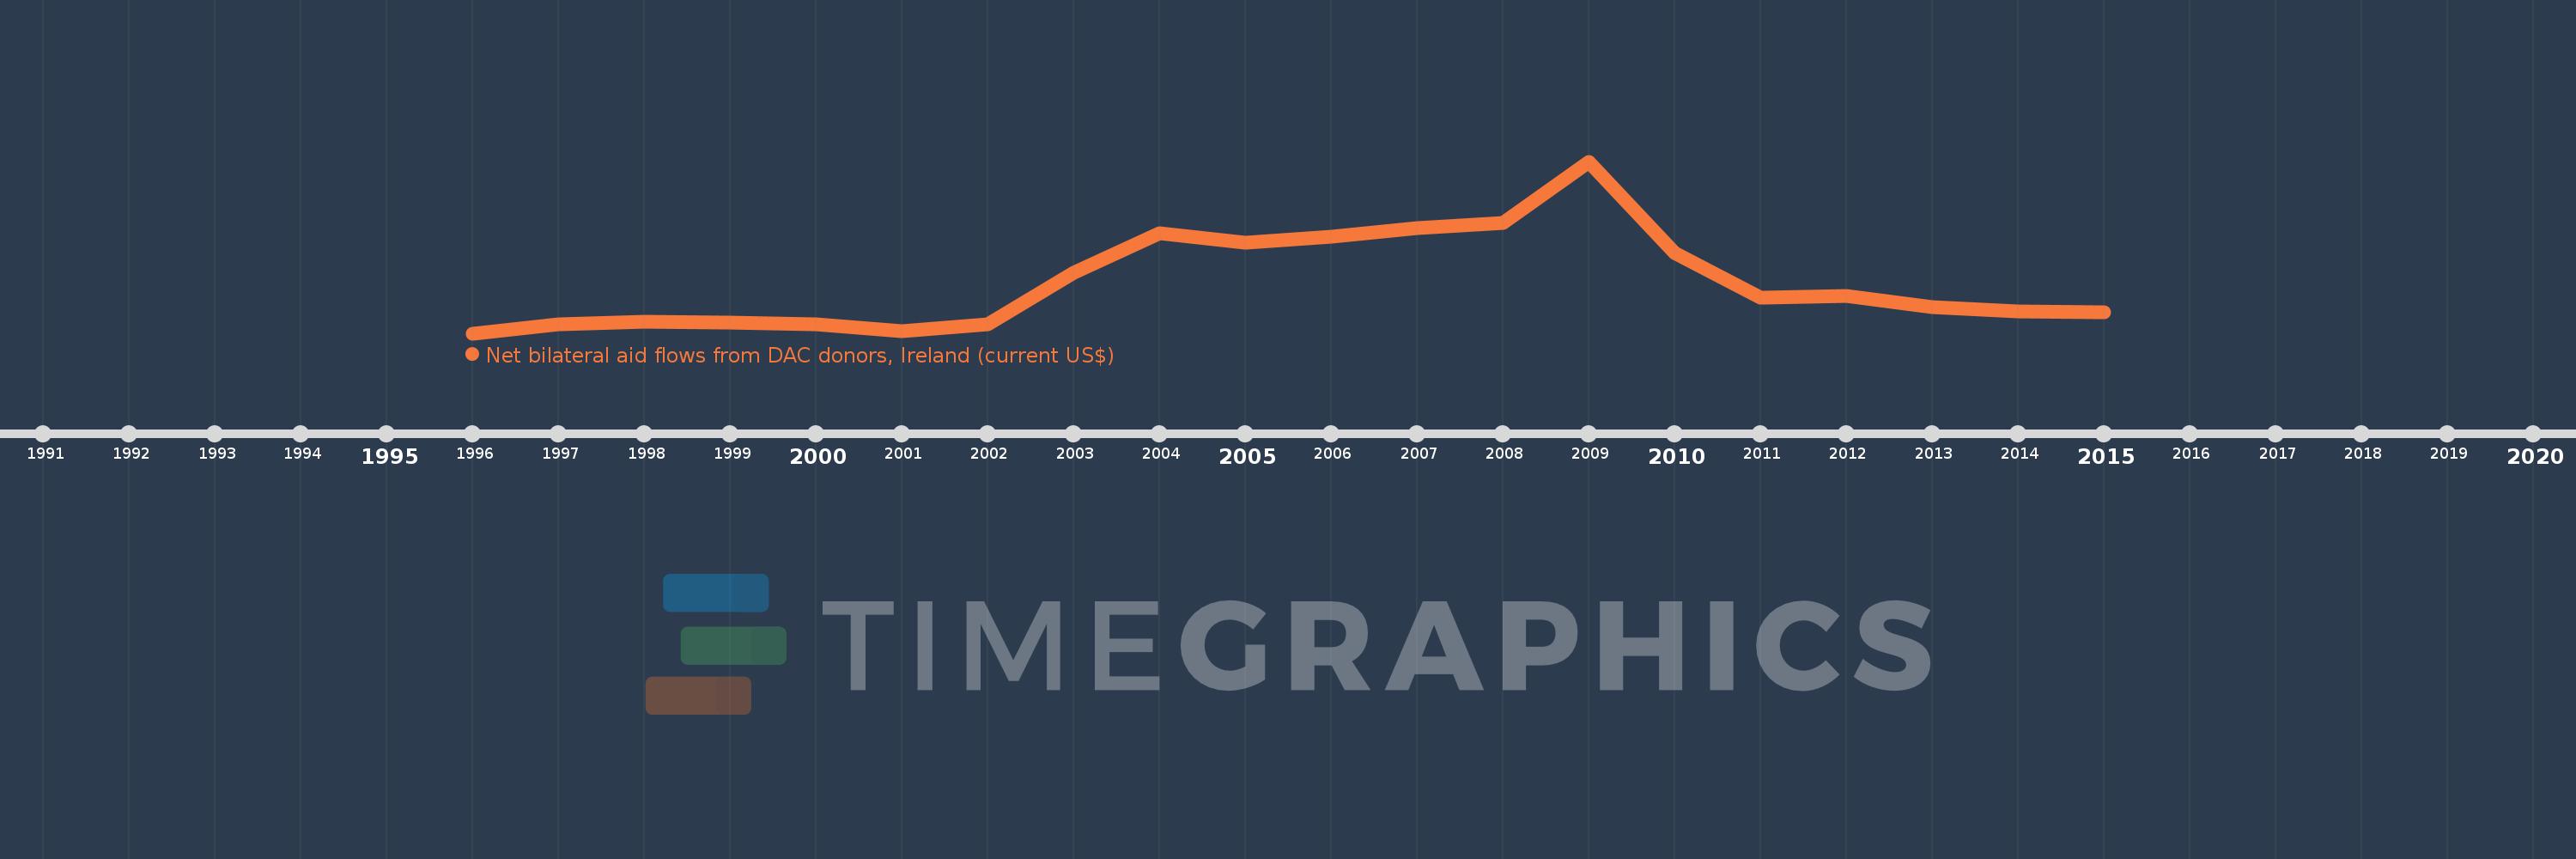
This timeline shows a graph from 1996 to 2015 of South Africa. No data until 1995. Number of actual observations by date: 20.

Source name:

World Development Indicators

Source organization:

Development Assistance Committee of the Organisation for Economic Co-operation and Development, Geographical Distribution of Financial Flows to Developing Countries, Development Co-operation Report, and International Development Statistics database. Data are available online at: www.oecd.org/dac/stats/idsonline.

Categories, topics:

Aid Effectiveness

Last updated:

apr 23, 2017

Indicators value changes by year

Meaning:
10.64 mln
Minimum:
2.95 mln
jan 1, 1996
Maximum:
29.13 mln
jan 1, 2009
At the date of observation
Value
Absolute change
Change from the previous value
jan 1, 1996
2.95 mln
+2.95 mln
0.0%
jan 1, 1997
4.35 mln
+1.4 mln
47.46%
jan 1, 1998
4.7 mln
+350.0K
8.05%
jan 1, 1999
4.59 mln
-110.0K
-2.34%
jan 1, 2000
4.26 mln
-330.0K
-7.19%
jan 1, 2001
3.24 mln
-1.02 mln
-23.94%
jan 1, 2002
4.34 mln
+1.1 mln
33.95%
jan 1, 2003
12.14 mln
+7.8 mln
179.72%
jan 1, 2004
18.26 mln
+6.12 mln
50.41%
jan 1, 2005
16.75 mln
-1.51 mln
-8.27%
jan 1, 2006
17.62 mln
+870.0K
5.19%
jan 1, 2007
18.95 mln
+1.33 mln
7.55%
jan 1, 2008
19.77 mln
+820.0K
4.33%
jan 1, 2009
29.13 mln
+9.36 mln
47.34%
jan 1, 2010
15.25 mln
-13.88 mln
-47.65%
jan 1, 2011
8.43 mln
-6.82 mln
-44.72%
jan 1, 2012
8.67 mln
+240.0K
2.85%
jan 1, 2013
6.97 mln
-1.7 mln
-19.61%
jan 1, 2014
6.28 mln
-690.0K
-9.9%
jan 1, 2015
6.16 mln
-120.0K
-1.91%

Ranking of countries by current statistics by years