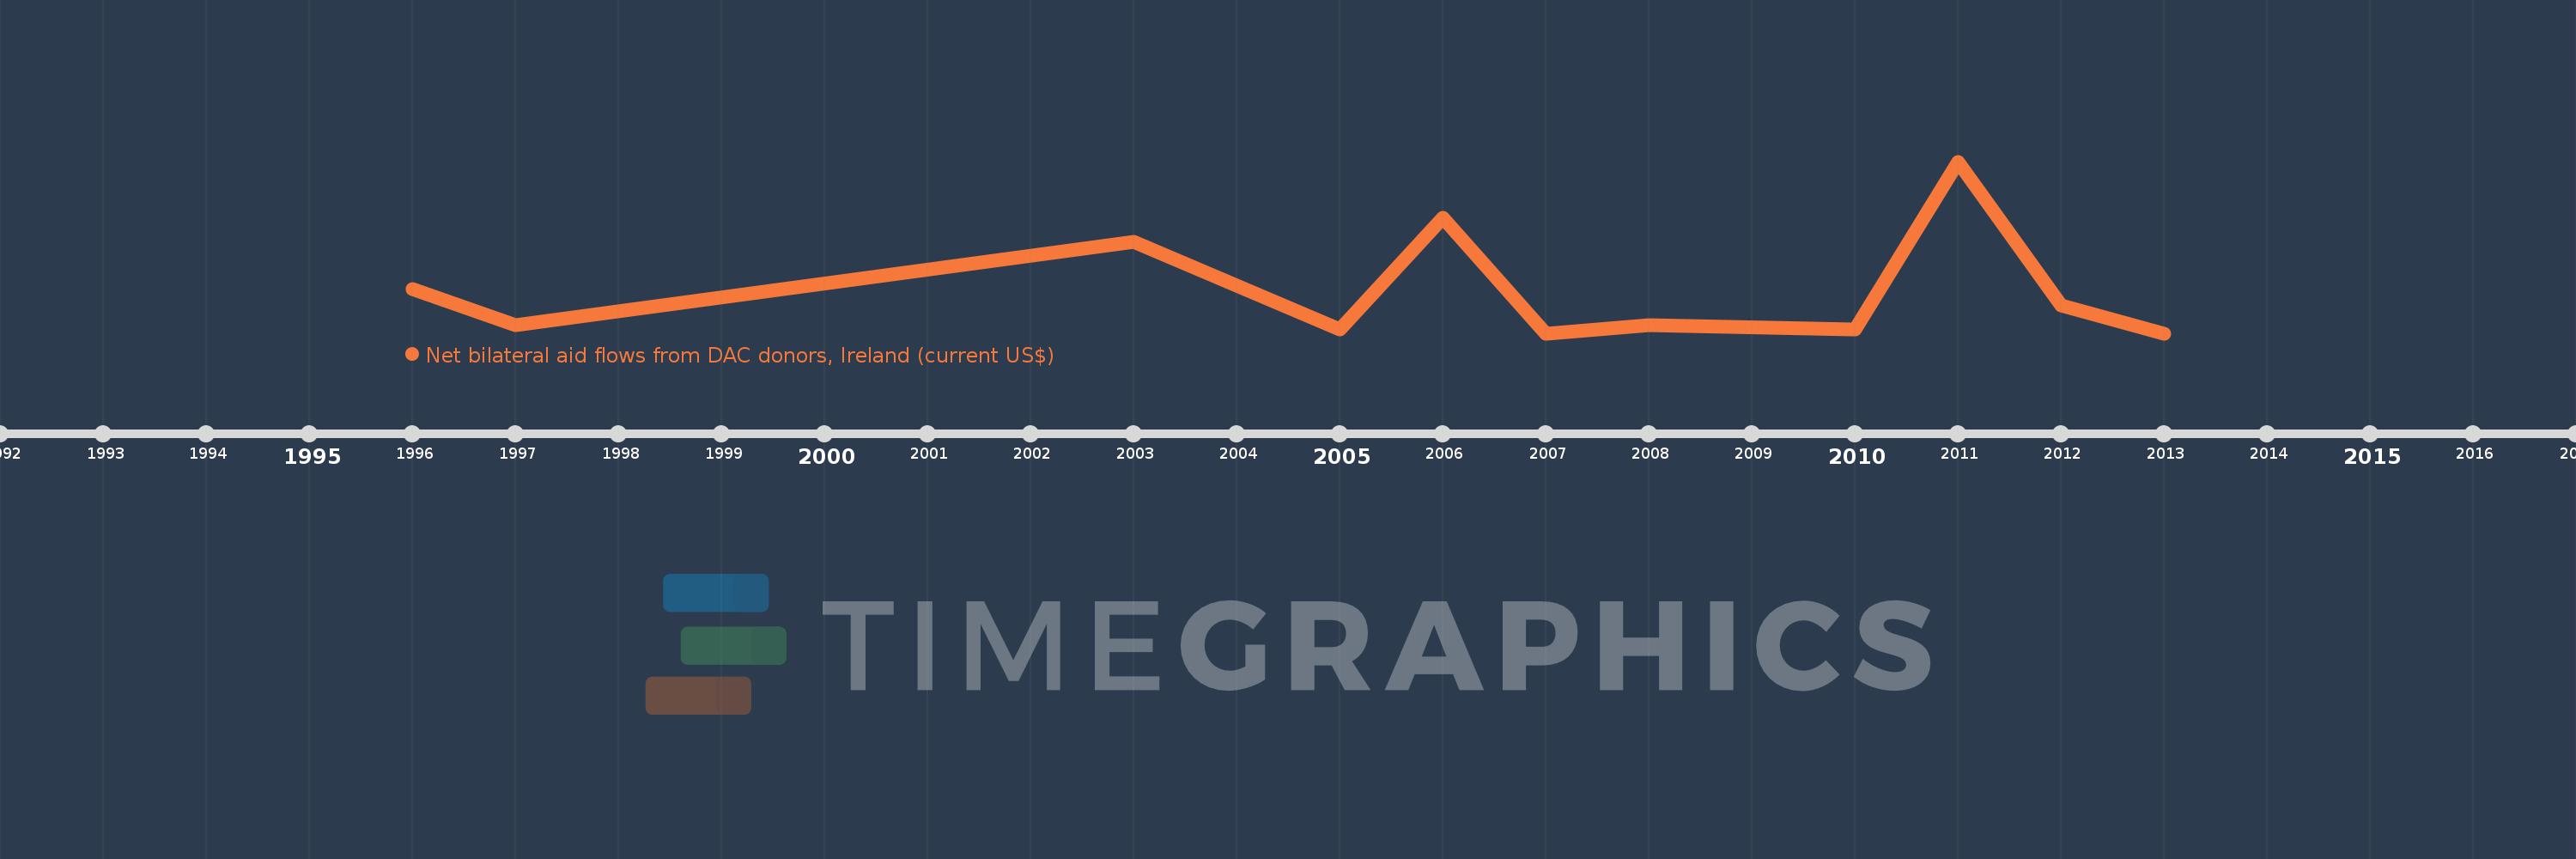
This timeline shows a graph from 1996 to 2013 of Kyrgyz Republic. No data until 1995. Number of actual observations by date: 11.
Source name:
World Development Indicators
Source organization:
Development Assistance Committee of the Organisation for Economic Co-operation and Development, Geographical Distribution of Financial Flows to Developing Countries, Development Co-operation Report, and International Development Statistics database. Data are available online at: www.oecd.org/dac/stats/idsonline.
Categories, topics:
Aid Effectiveness
Last updated:
apr 23, 2017
Indicators value changes by year
Meaning:
118.182K
Minimum:
10.0K
jan 1, 2007
Maximum:
440.0K
jan 1, 2011
At the date of observation
Value
Absolute change
Change from the previous value
jan 1, 1996
120.0K
+120.0K
0.0%
jan 1, 1997
30.0K
-90.0K
-75.0%
jan 1, 2003
240.0K
+210.0K
700.0%
jan 1, 2005
20.0K
-220.0K
-91.67%
jan 1, 2006
300.0K
+280.0K
1.4K%
jan 1, 2007
10.0K
-290.0K
-96.67%
jan 1, 2008
30.0K
+20.0K
200.0%
jan 1, 2010
20.0K
-10.0K
-33.33%
jan 1, 2011
440.0K
+420.0K
2.1K%
jan 1, 2012
80.0K
-360.0K
-81.82%
jan 1, 2013
10.0K
-70.0K
-87.5%
Ranking of countries by current statistics by years