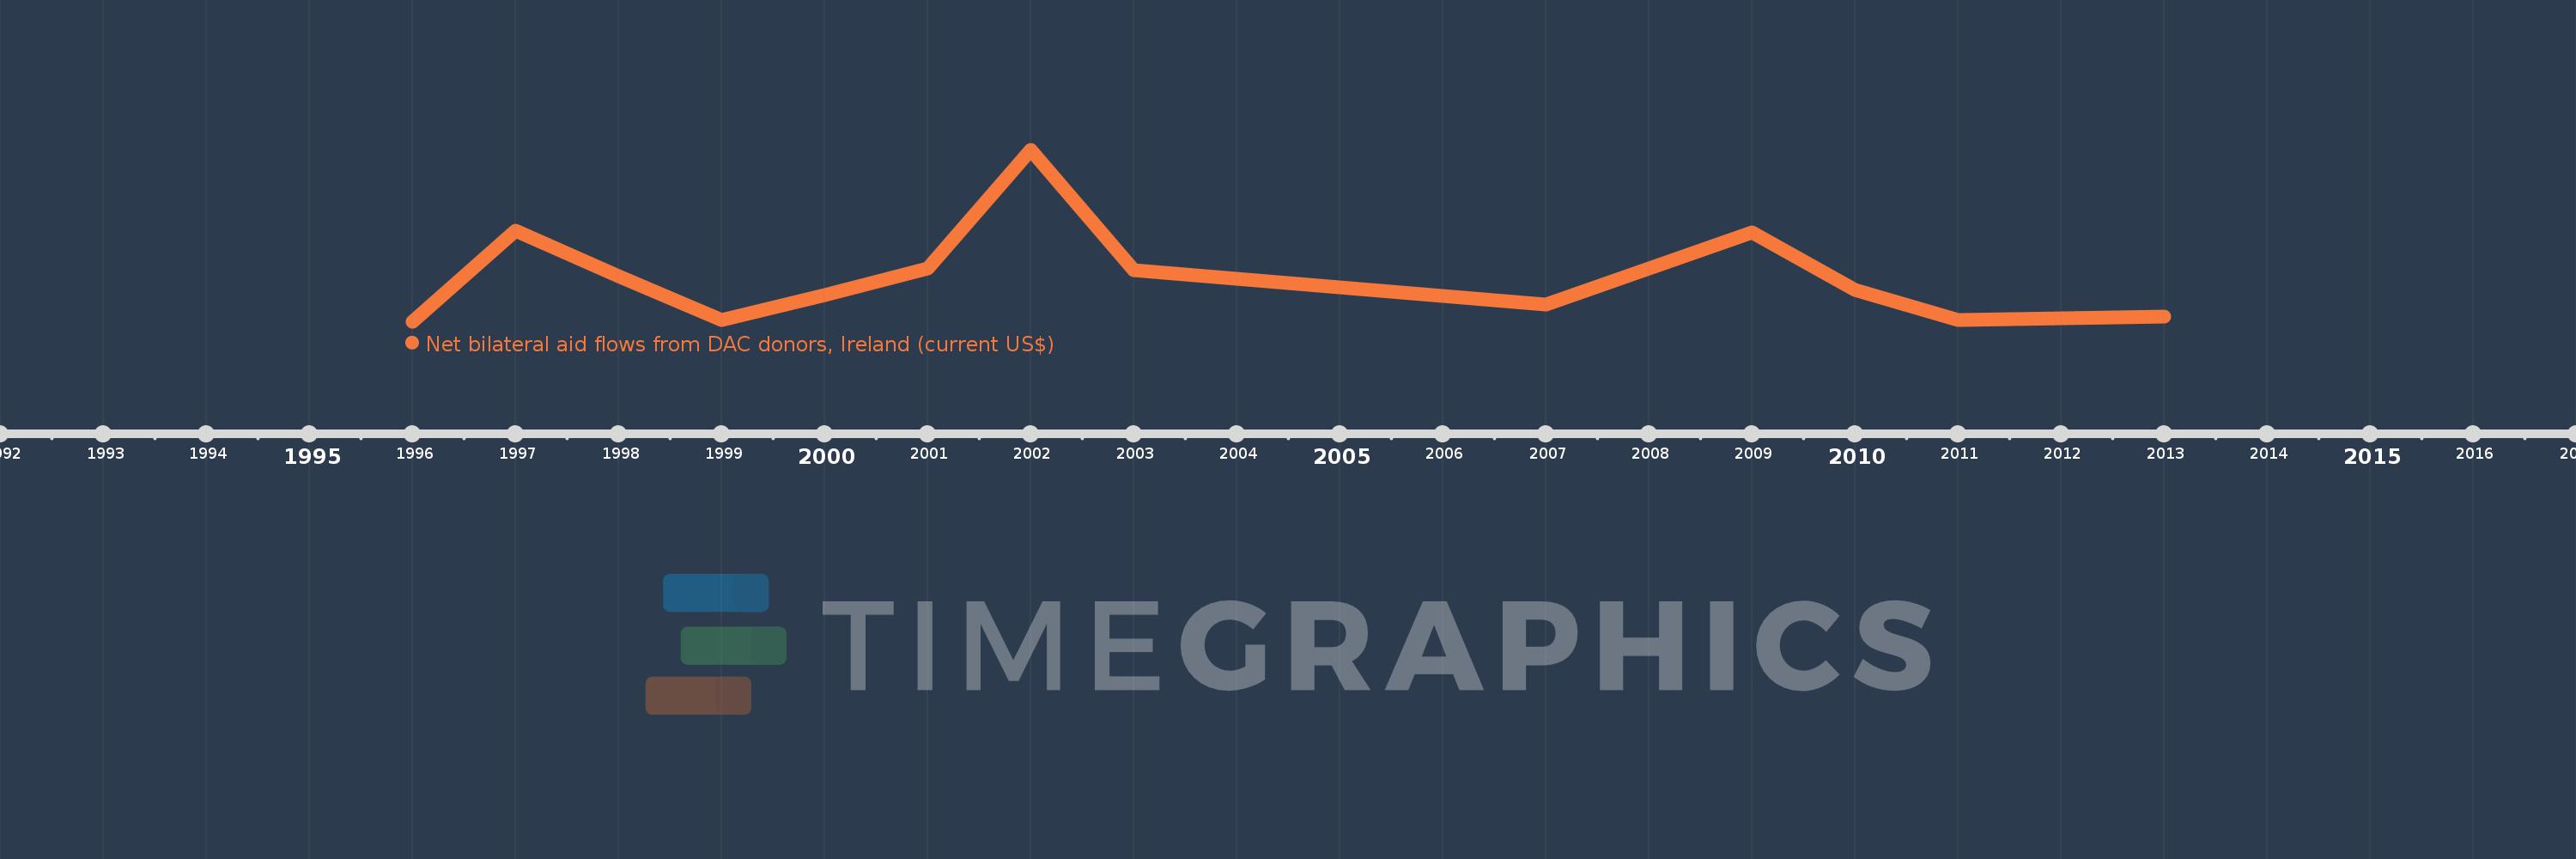
This timeline shows a graph from 1996 to 2013 of Tajikistan. No data until 1995. Number of actual observations by date: 13.
Source name:
World Development Indicators
Source organization:
Development Assistance Committee of the Organisation for Economic Co-operation and Development, Geographical Distribution of Financial Flows to Developing Countries, Development Co-operation Report, and International Development Statistics database. Data are available online at: www.oecd.org/dac/stats/idsonline.
Categories, topics:
Aid Effectiveness
Last updated:
apr 23, 2017
Indicators value changes by year
Meaning:
247.692K
Minimum:
10.0K
jan 1, 1996
Maximum:
910.0K
jan 1, 2002
At the date of observation
Value
Absolute change
Change from the previous value
jan 1, 1996
10.0K
+10.0K
0.0%
jan 1, 1997
490.0K
+480.0K
4.8K%
jan 1, 1998
250.0K
-240.0K
-48.98%
jan 1, 1999
20.0K
-230.0K
-92.0%
jan 1, 2000
150.0K
+130.0K
650.0%
jan 1, 2001
290.0K
+140.0K
93.33%
jan 1, 2002
910.0K
+620.0K
213.79%
jan 1, 2003
280.0K
-630.0K
-69.23%
jan 1, 2007
100.0K
-180.0K
-64.29%
jan 1, 2009
480.0K
+380.0K
380.0%
jan 1, 2010
180.0K
-300.0K
-62.5%
jan 1, 2011
20.0K
-160.0K
-88.89%
jan 1, 2013
40.0K
+20.0K
100.0%
Ranking of countries by current statistics by years