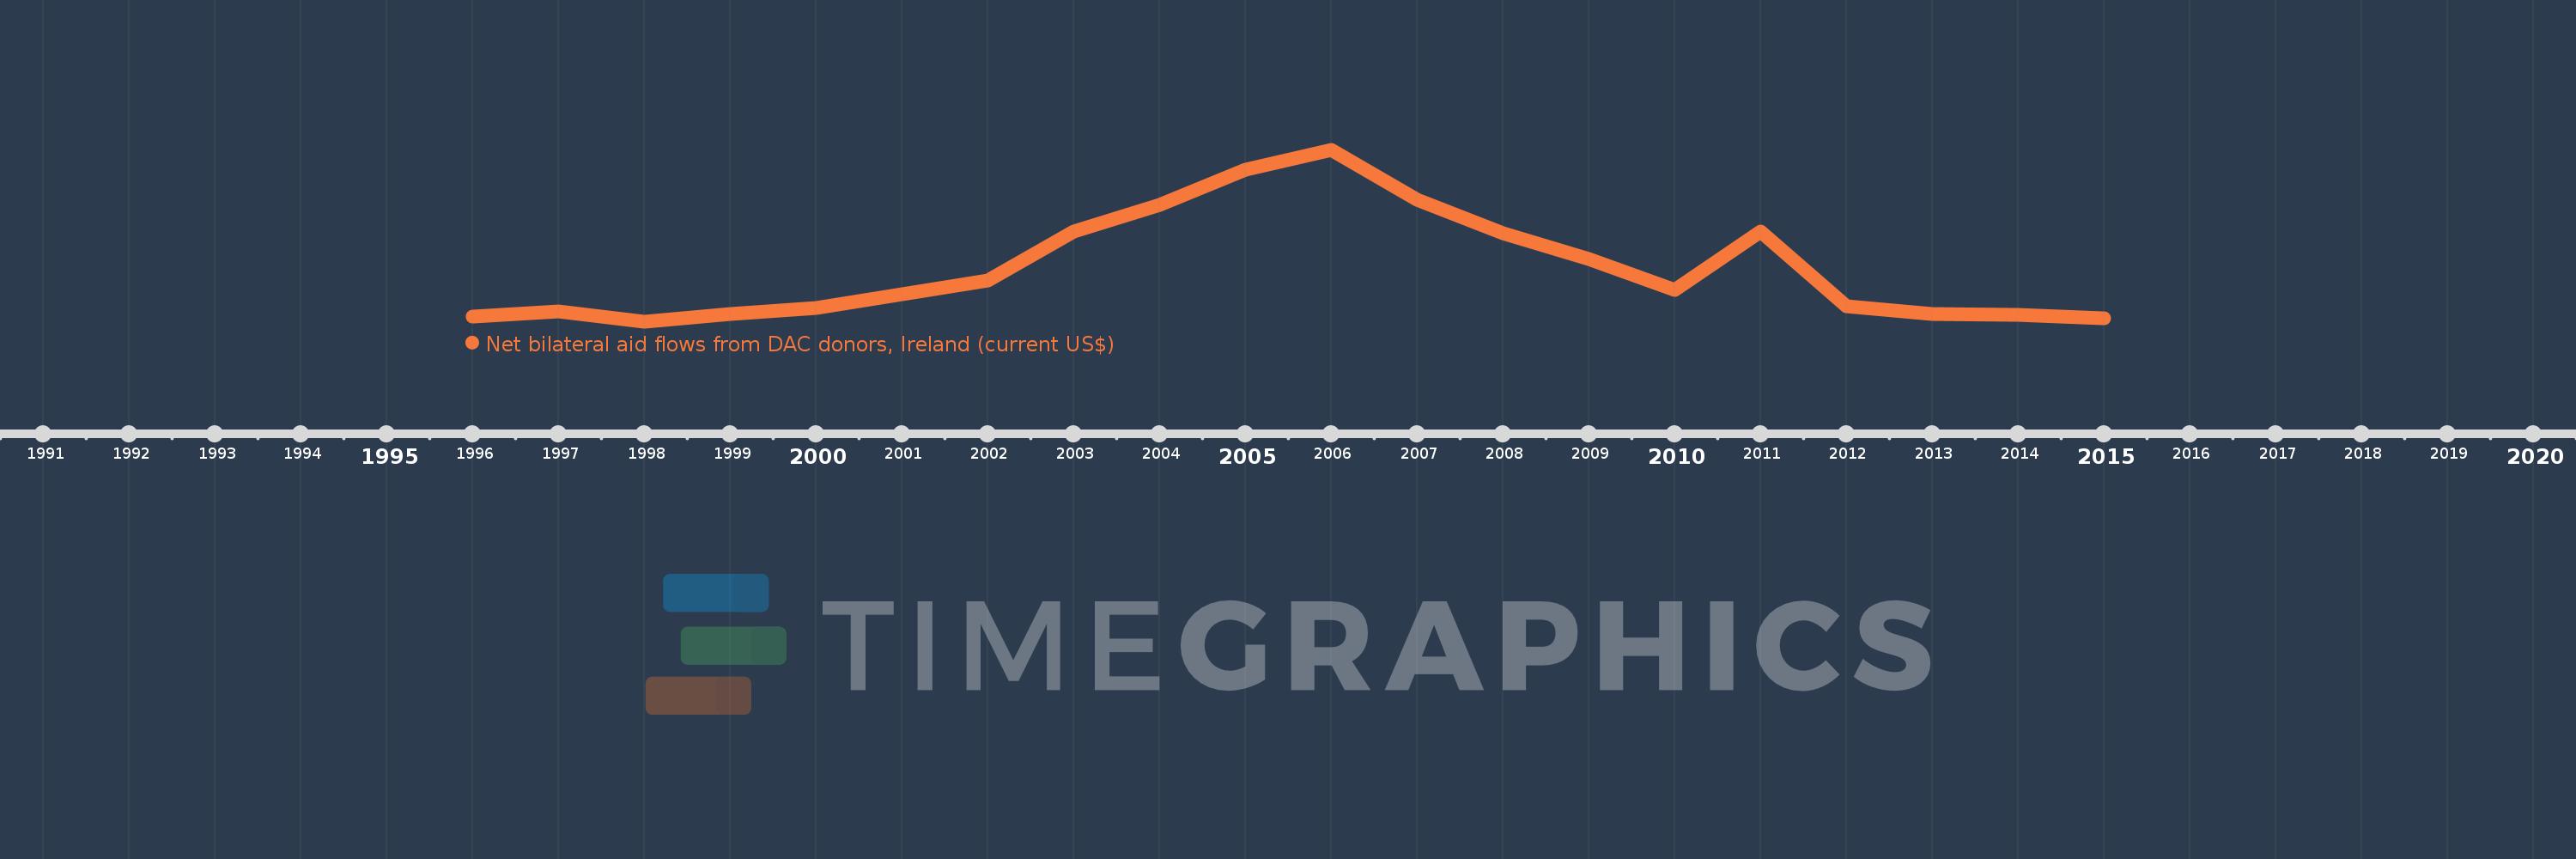
This timeline shows a graph from 1996 to 2015 of Eritrea. No data until 1995. Number of actual observations by date: 20.
Source name:
World Development Indicators
Source organization:
Development Assistance Committee of the Organisation for Economic Co-operation and Development, Geographical Distribution of Financial Flows to Developing Countries, Development Co-operation Report, and International Development Statistics database. Data are available online at: www.oecd.org/dac/stats/idsonline.
Categories, topics:
Aid Effectiveness
Last updated:
apr 23, 2017
Indicators value changes by year
Meaning:
948.0K
Minimum:
110.0K
jan 1, 1998
Maximum:
2.8 mln
jan 1, 2006
At the date of observation
Value
Absolute change
Change from the previous value
jan 1, 1996
190.0K
+190.0K
0.0%
jan 1, 1997
280.0K
+90.0K
47.37%
jan 1, 1998
110.0K
-170.0K
-60.71%
jan 1, 1999
240.0K
+130.0K
118.18%
jan 1, 2000
330.0K
+90.0K
37.5%
jan 1, 2001
540.0K
+210.0K
63.64%
jan 1, 2002
760.0K
+220.0K
40.74%
jan 1, 2003
1.53 mln
+770.0K
101.32%
jan 1, 2004
1.94 mln
+410.0K
26.8%
jan 1, 2005
2.5 mln
+560.0K
28.87%
jan 1, 2006
2.8 mln
+300.0K
12.0%
jan 1, 2007
2.03 mln
-770.0K
-27.5%
jan 1, 2008
1.5 mln
-530.0K
-26.11%
jan 1, 2009
1.1 mln
-400.0K
-26.67%
jan 1, 2010
610.0K
-490.0K
-44.55%
jan 1, 2011
1.53 mln
+920.0K
150.82%
jan 1, 2012
350.0K
-1.18 mln
-77.12%
jan 1, 2013
230.0K
-120.0K
-34.29%
jan 1, 2014
220.0K
-10.0K
-4.35%
jan 1, 2015
170.0K
-50.0K
-22.73%
Ranking of countries by current statistics by years