33
/
AIzaSyAYiBZKx7MnpbEhh9jyipgxe19OcubqV5w
August 1, 2025
156341
Indonesia
IDN
true
2
1
Net bilateral aid flows from DAC donors, Ireland (current US$)
2015,2014,2013,2011,2010,2009,2008,2007,2006,2005,2003,2002,2001,2000,1999,1998,1997,1995,1994,1993,1988
Download
Global statistics library →Indonesia →

Net bilateral aid flows from DAC donors, Ireland (current US$)

This statistics in other country:

AfghanistanAlbaniaAlgeriaAngolaArab WorldArgentinaArmeniaAzerbaijanBangladeshBelarusBelizeBeninBhutanBoliviaBosnia and HerzegovinaBotswanaBrazilBulgariaBurkina FasoBurundiCambodiaCameroonCaribbean small statesCentral African RepublicCentral Europe and the BalticsChadChileChinaColombiaComorosCongo, Dem. Rep.Congo, Rep.Costa RicaCote d'IvoireCroatiaCubaCzech RepublicDjiboutiDominican RepublicEast Asia & PacificEast Asia & Pacific (excluding high income)East Asia & Pacific (IDA & IBRD countries)EcuadorEgypt, Arab Rep.El SalvadorEquatorial GuineaEritreaEthiopiaEuro areaEurope & Central AsiaEurope & Central Asia (excluding high income)Europe & Central Asia (IDA & IBRD countries)European UnionFijiFragile and conflict affected situationsGabonGambia, TheGeorgiaGhanaGrenadaGuatemalaGuineaGuinea-BissauGuyanaHaitiHeavily indebted poor countries (HIPC)High incomeHondurasHong Kong SAR, ChinaHungaryIBRD onlyIDA & IBRD totalIDA blendIDA onlyIDA totalIndiaIndonesiaIran, Islamic Rep.IraqIsraelJamaicaJordanKazakhstanKenyaKorea, Dem. People’s Rep.Korea, Rep.KosovoKyrgyz RepublicLao PDRLatin America & Caribbean Latin America & Caribbean (excluding high income)Latin America & the Caribbean (IDA & IBRD countries)LatviaLeast developed countries: UN classificationLebanonLesothoLiberiaLibyaLithuaniaLow & middle incomeLow incomeLower middle incomeMacedonia, FYRMadagascarMalawiMalaysiaMaldivesMaliMauritaniaMauritiusMexicoMicronesia, Fed. Sts.Middle East & North AfricaMiddle East & North Africa (excluding high income)Middle East & North Africa (IDA & IBRD countries)Middle incomeMoldovaMongoliaMontenegroMoroccoMozambiqueMyanmarNamibiaNepalNicaraguaNigerNigeriaOECD membersOther small statesPacific island small statesPakistanPanamaPapua New GuineaParaguayPeruPhilippinesPolandRomaniaRussian FederationRwandaSamoaSao Tome and PrincipeSenegalSerbiaSeychellesSierra LeoneSlovak RepublicSloveniaSmall statesSolomon IslandsSomaliaSouth AfricaSouth AsiaSouth Asia (IDA & IBRD)South SudanSri LankaSt. LuciaSub-Saharan Africa Sub-Saharan Africa (excluding high income)Sub-Saharan Africa (IDA & IBRD countries)SudanSurinameSwazilandSyrian Arab RepublicTajikistanTanzaniaThailandTimor-LesteTogoTrinidad and TobagoTunisiaTurkeyTurkmenistanUgandaUkraineUpper middle incomeUruguayUzbekistanVanuatuVenezuela, RBVietnamWest Bank and GazaWorldYemen, Rep.ZambiaZimbabwe

Timeline:

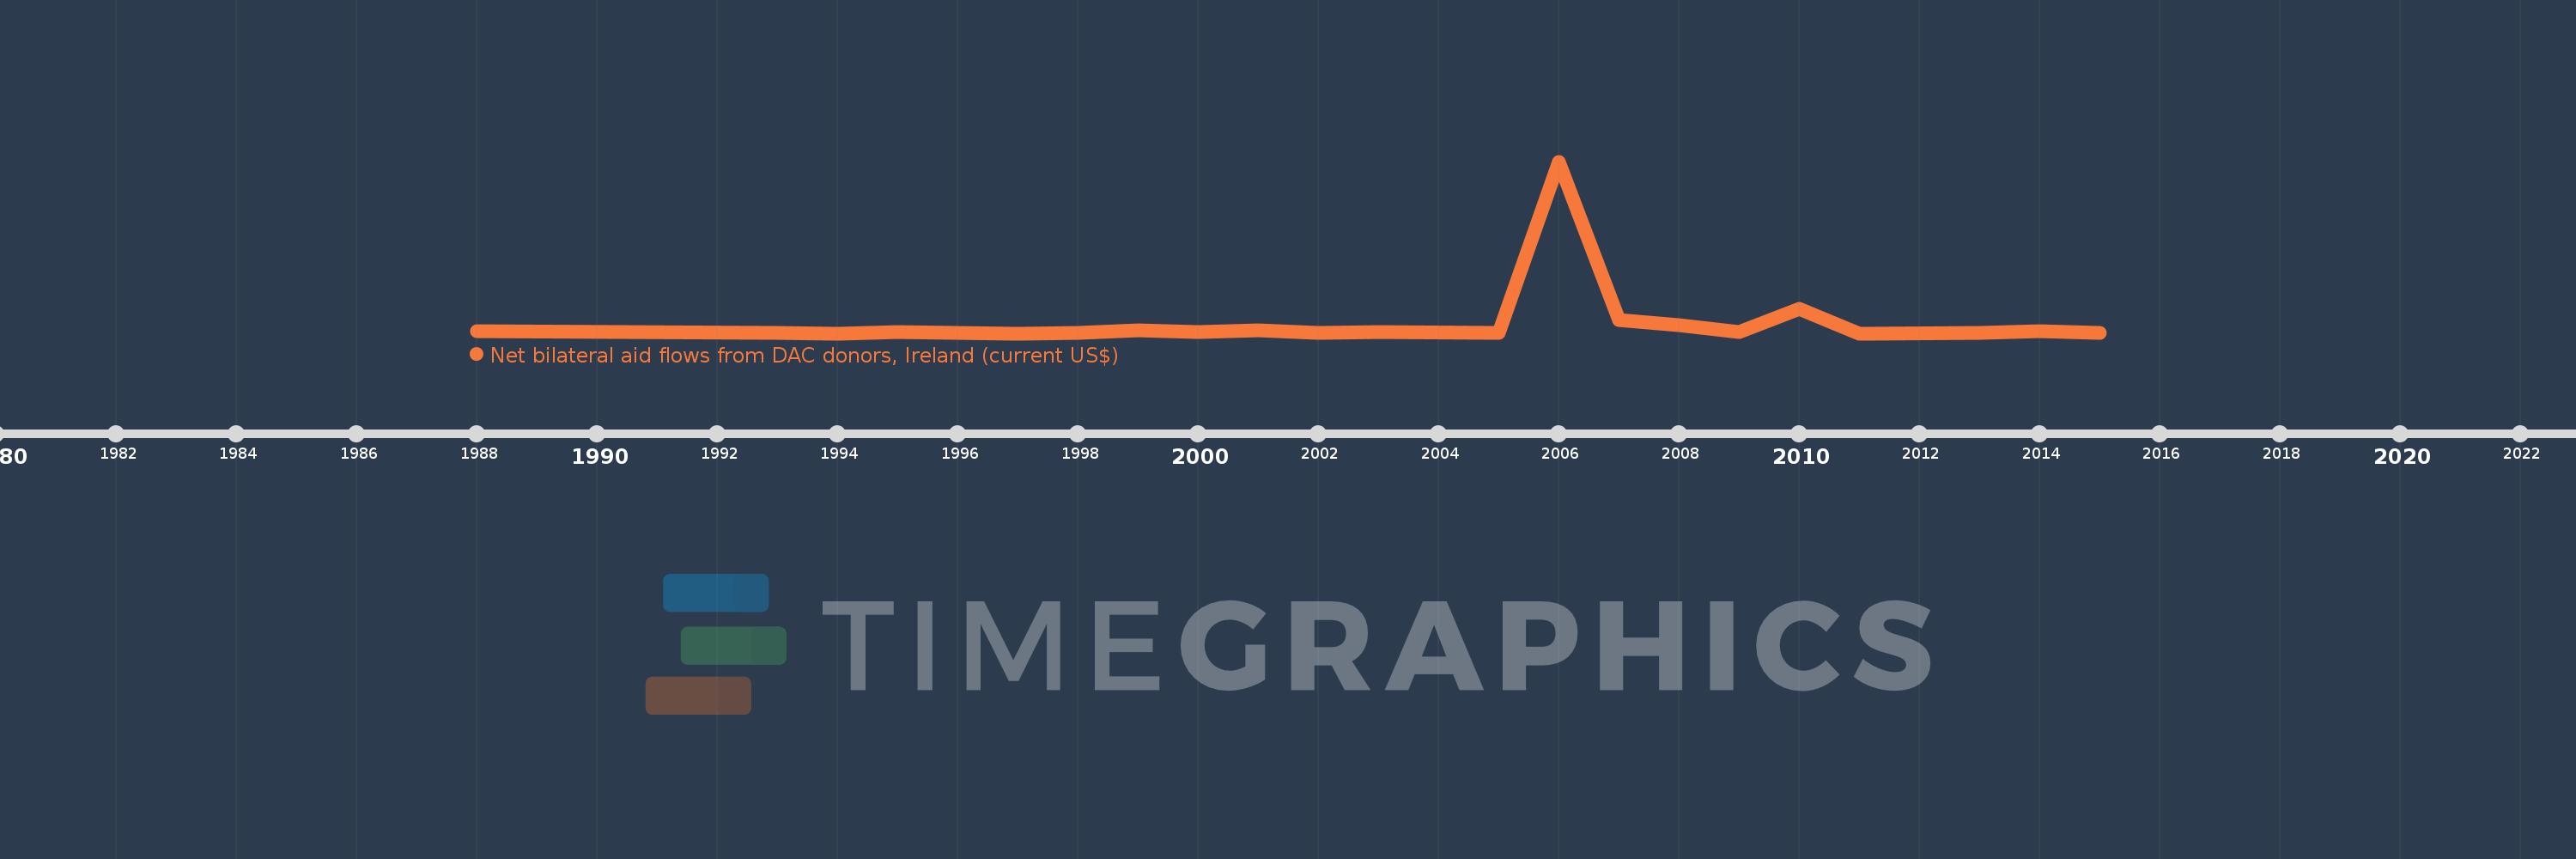
This timeline shows a graph from 1988 to 2015 of Indonesia. No data until 1987. Number of actual observations by date: 21.

Source name:

World Development Indicators

Source organization:

Development Assistance Committee of the Organisation for Economic Co-operation and Development, Geographical Distribution of Financial Flows to Developing Countries, Development Co-operation Report, and International Development Statistics database. Data are available online at: www.oecd.org/dac/stats/idsonline.

Categories, topics:

Aid Effectiveness

Last updated:

apr 23, 2017

Indicators value changes by year

Meaning:
545.714K
Minimum:
10.0K
jan 1, 1994
Maximum:
8.19 mln
jan 1, 2006
At the date of observation
Value
Absolute change
Change from the previous value
jan 1, 1988
100.0K
+100.0K
0.0%
jan 1, 1993
20.0K
-80.0K
-80.0%
jan 1, 1994
10.0K
-10.0K
-50.0%
jan 1, 1995
70.0K
+60.0K
600.0%
jan 1, 1997
10.0K
-60.0K
-85.71%
jan 1, 1998
50.0K
+40.0K
400.0%
jan 1, 1999
170.0K
+120.0K
240.0%
jan 1, 2000
70.0K
-100.0K
-58.82%
jan 1, 2001
140.0K
+70.0K
100.0%
jan 1, 2002
30.0K
-110.0K
-78.57%
jan 1, 2003
70.0K
+40.0K
133.33%
jan 1, 2005
30.0K
-40.0K
-57.14%
jan 1, 2006
8.19 mln
+8.16 mln
27.2K%
jan 1, 2007
640.0K
-7.55 mln
-92.19%
jan 1, 2008
410.0K
-230.0K
-35.94%
jan 1, 2009
80.0K
-330.0K
-80.49%
jan 1, 2010
1.19 mln
+1.11 mln
1.39K%
jan 1, 2011
10.0K
-1.18 mln
-99.16%
jan 1, 2013
30.0K
+20.0K
200.0%
jan 1, 2014
120.0K
+90.0K
300.0%
jan 1, 2015
20.0K
-100.0K
-83.33%

Ranking of countries by current statistics by years