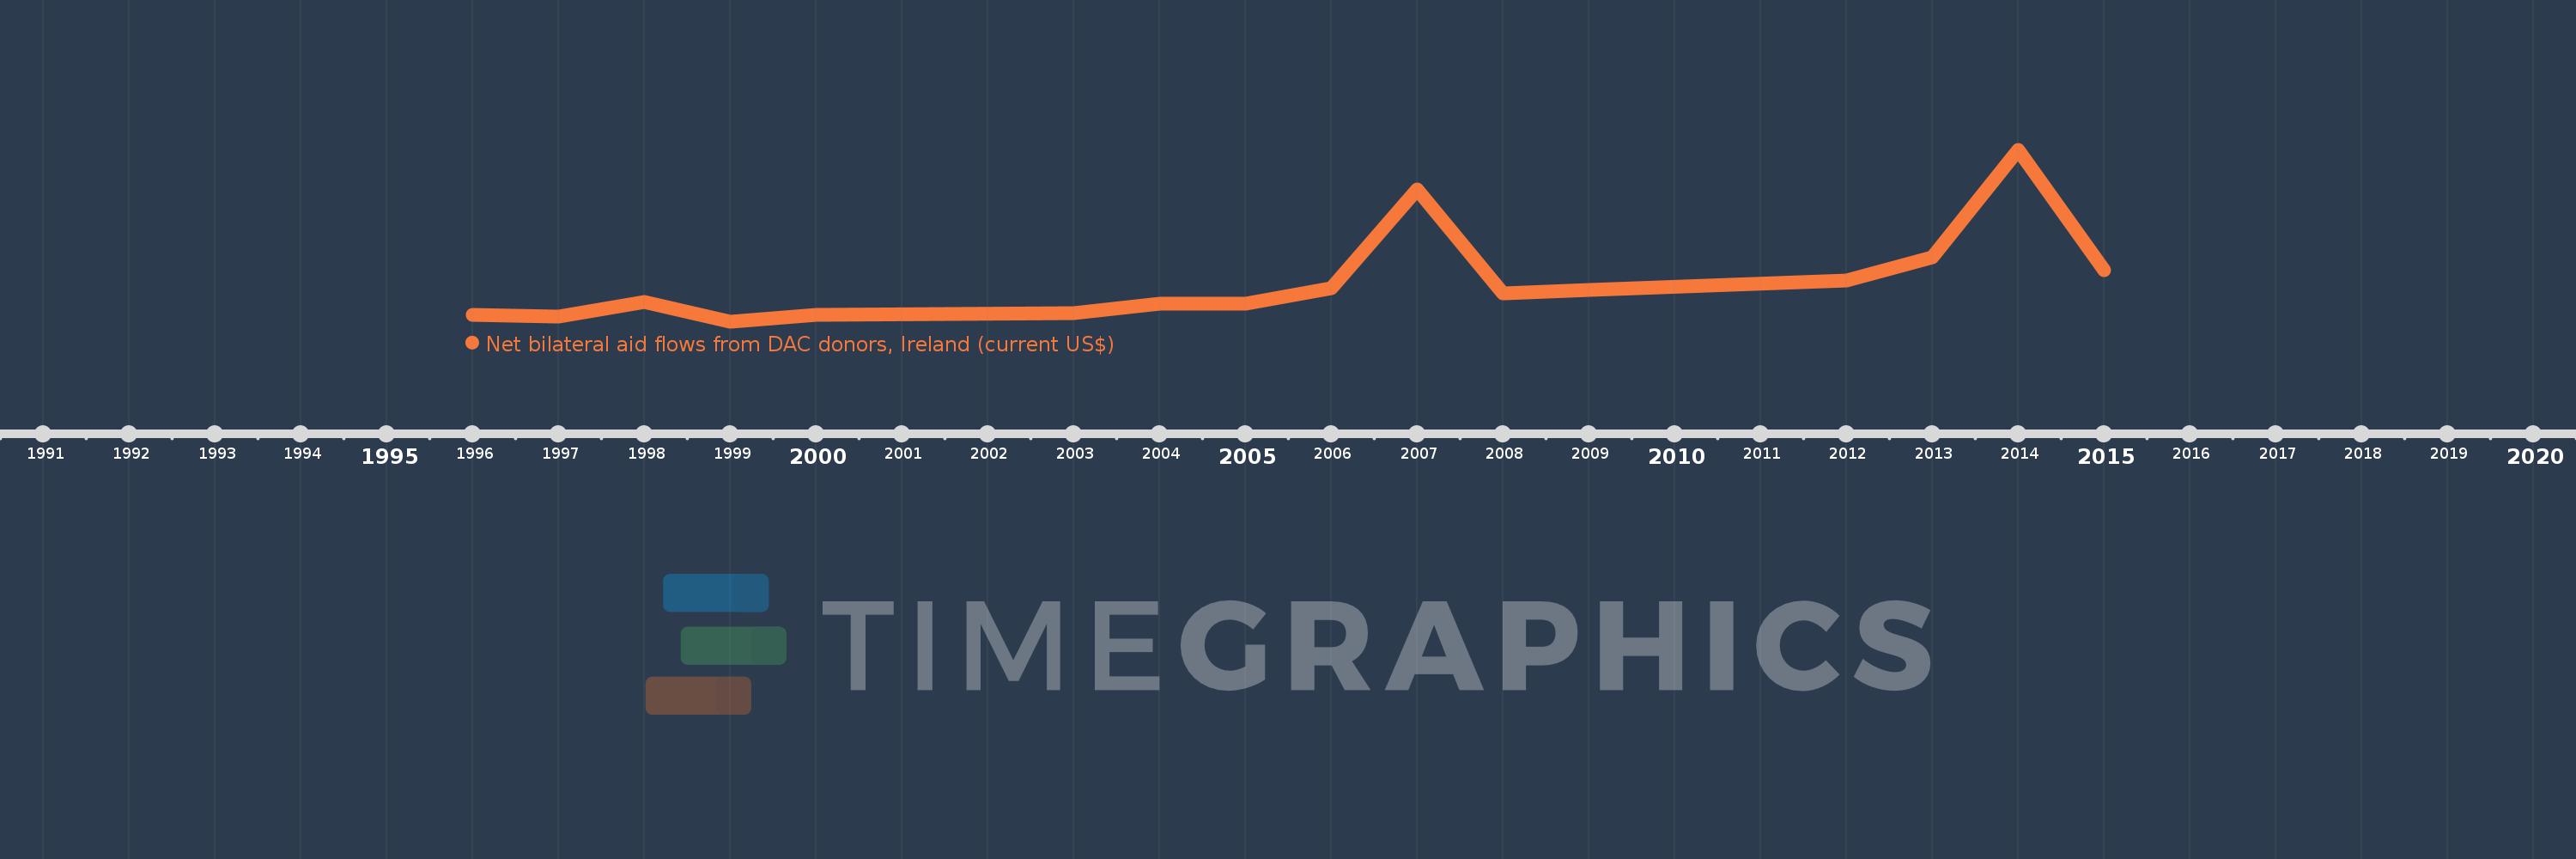
This timeline shows a graph from 1996 to 2015 of Mauritania. No data until 1995. Number of actual observations by date: 16.
Source name:
World Development Indicators
Source organization:
Development Assistance Committee of the Organisation for Economic Co-operation and Development, Geographical Distribution of Financial Flows to Developing Countries, Development Co-operation Report, and International Development Statistics database. Data are available online at: www.oecd.org/dac/stats/idsonline.
Categories, topics:
Aid Effectiveness
Last updated:
apr 23, 2017
Indicators value changes by year
Meaning:
243.75K
Minimum:
20.0K
jan 1, 1999
Maximum:
980.0K
jan 1, 2014
At the date of observation
Value
Absolute change
Change from the previous value
jan 1, 1996
60.0K
+60.0K
0.0%
jan 1, 1997
50.0K
-10.0K
-16.67%
jan 1, 1998
130.0K
+80.0K
160.0%
jan 1, 1999
20.0K
-110.0K
-84.62%
jan 1, 2000
60.0K
+40.0K
200.0%
jan 1, 2003
70.0K
+10.0K
16.67%
jan 1, 2004
120.0K
+50.0K
71.43%
jan 1, 2005
120.0K
0.0
0.0%
jan 1, 2006
210.0K
+90.0K
75.0%
jan 1, 2007
760.0K
+550.0K
261.9%
jan 1, 2008
180.0K
-580.0K
-76.32%
jan 1, 2009
200.0K
+20.0K
11.11%
jan 1, 2012
250.0K
+50.0K
25.0%
jan 1, 2013
380.0K
+130.0K
52.0%
jan 1, 2014
980.0K
+600.0K
157.89%
jan 1, 2015
310.0K
-670.0K
-68.37%
Ranking of countries by current statistics by years