This timeline shows a graph from 1998 to 2014 of Serbia. No data until 1997. Number of actual observations by date: 15.
Source name:
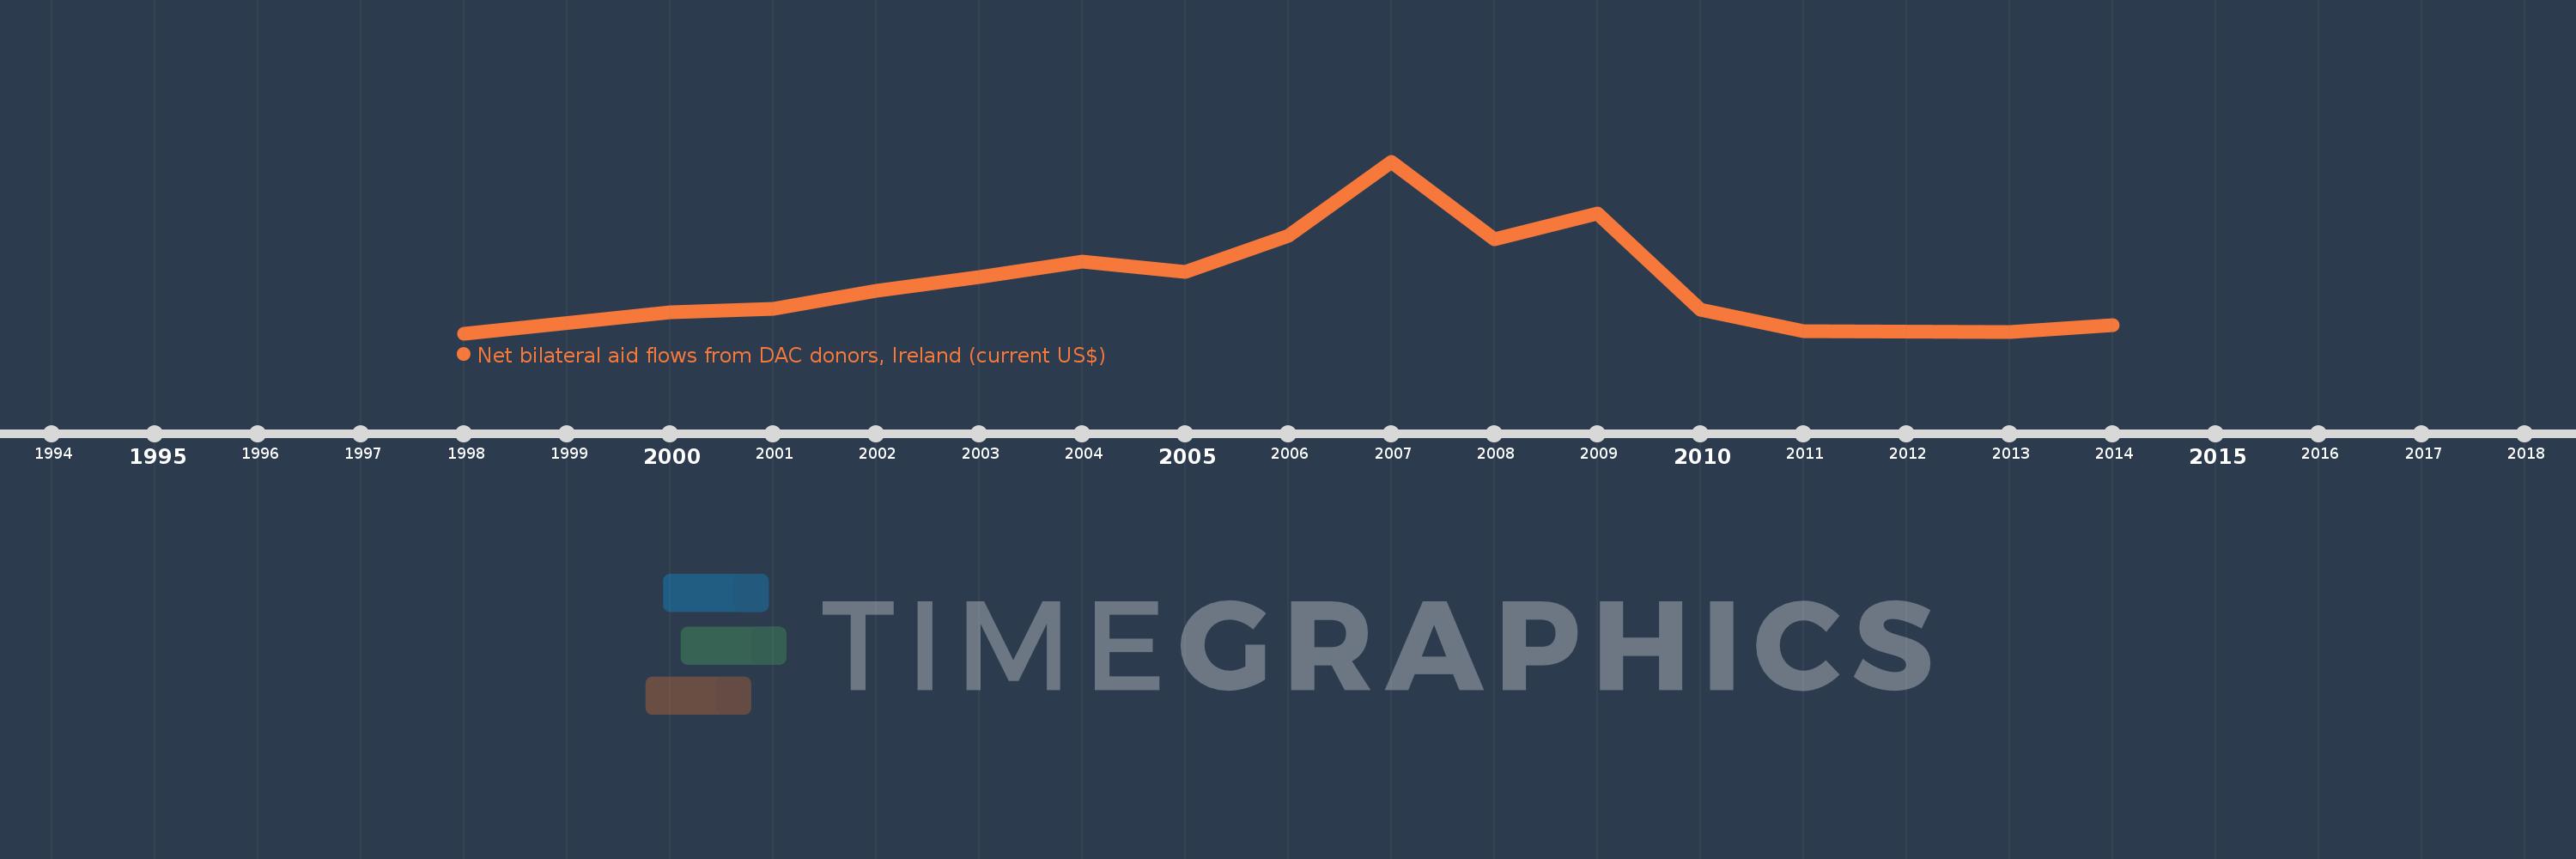
World Development Indicators
Source organization:
Development Assistance Committee of the Organisation for Economic Co-operation and Development, Geographical Distribution of Financial Flows to Developing Countries, Development Co-operation Report, and International Development Statistics database. Data are available online at: www.oecd.org/dac/stats/idsonline.
Categories, topics:
Aid Effectiveness
Last updated:
apr 23, 2017
Indicators value changes by year
Meaning:
627.333K
Minimum:
20.0K
jan 1, 1998
Maximum:
1.99 mln
jan 1, 2007
At the date of observation
Value
Absolute change
Change from the previous value
jan 1, 1998
20.0K
+20.0K
0.0%
jan 1, 2000
260.0K
+240.0K
1.2K%
jan 1, 2001
300.0K
+40.0K
15.38%
jan 1, 2002
510.0K
+210.0K
70.0%
jan 1, 2003
670.0K
+160.0K
31.37%
jan 1, 2004
840.0K
+170.0K
25.37%
jan 1, 2005
720.0K
-120.0K
-14.29%
jan 1, 2006
1.14 mln
+420.0K
58.33%
jan 1, 2007
1.99 mln
+850.0K
74.56%
jan 1, 2008
1.1 mln
-890.0K
-44.72%
jan 1, 2009
1.39 mln
+290.0K
26.36%
jan 1, 2010
290.0K
-1.1 mln
-79.14%
jan 1, 2011
40.0K
-250.0K
-86.21%
jan 1, 2013
30.0K
-10.0K
-25.0%
jan 1, 2014
110.0K
+80.0K
266.67%
Ranking of countries by current statistics by years