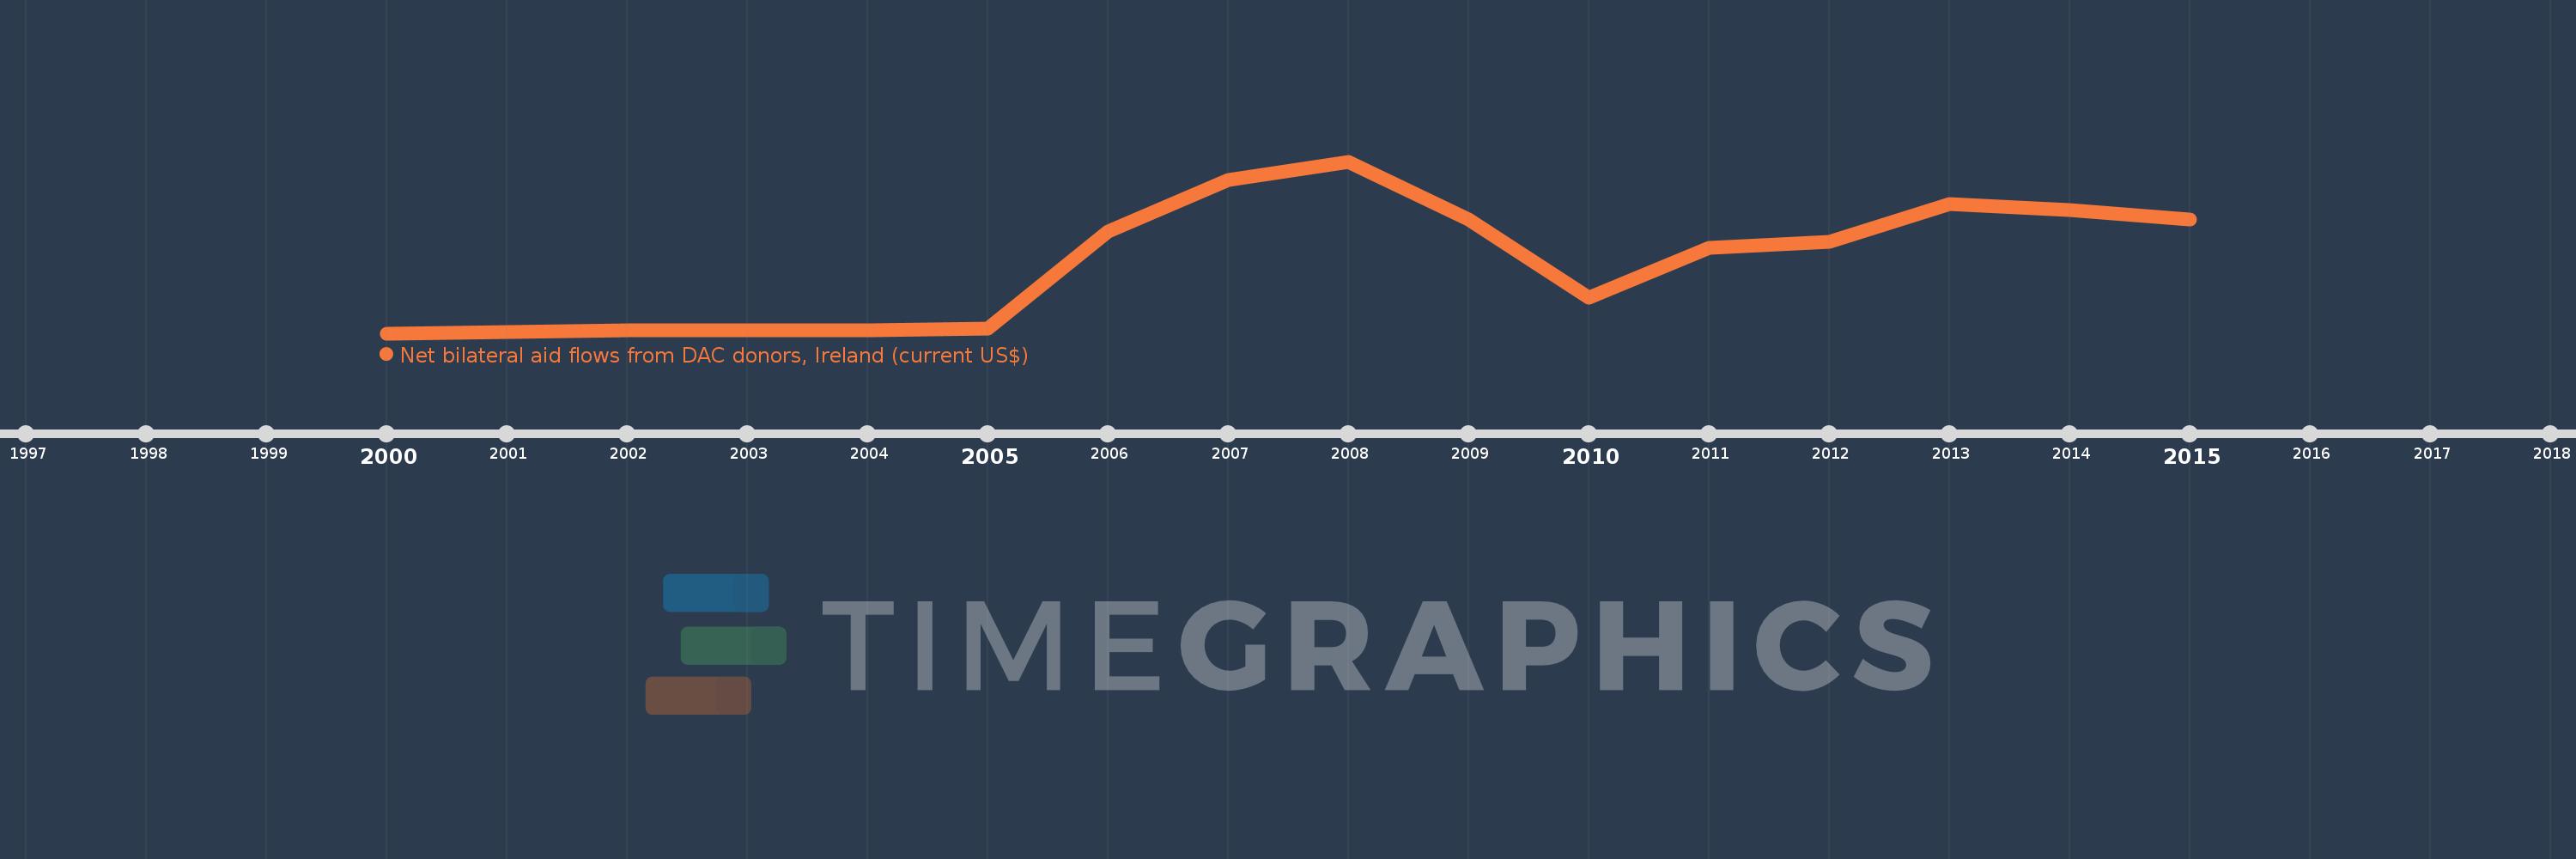
This timeline shows a graph from 2000 to 2015 of Niger. No data until 1999. Number of actual observations by date: 14.
Source name:
World Development Indicators
Source organization:
Development Assistance Committee of the Organisation for Economic Co-operation and Development, Geographical Distribution of Financial Flows to Developing Countries, Development Co-operation Report, and International Development Statistics database. Data are available online at: www.oecd.org/dac/stats/idsonline.
Categories, topics:
Aid Effectiveness
Last updated:
apr 23, 2017
Indicators value changes by year
Meaning:
2.148 mln
Minimum:
40.0K
jan 1, 2000
Maximum:
4.53 mln
jan 1, 2008
At the date of observation
Value
Absolute change
Change from the previous value
jan 1, 2000
40.0K
+40.0K
0.0%
jan 1, 2002
120.0K
+80.0K
200.0%
jan 1, 2004
110.0K
-10.0K
-8.33%
jan 1, 2005
170.0K
+60.0K
54.55%
jan 1, 2006
2.69 mln
+2.52 mln
1.48K%
jan 1, 2007
4.04 mln
+1.35 mln
50.19%
jan 1, 2008
4.53 mln
+490.0K
12.13%
jan 1, 2009
3.02 mln
-1.51 mln
-33.33%
jan 1, 2010
970.0K
-2.05 mln
-67.88%
jan 1, 2011
2.27 mln
+1.3 mln
134.02%
jan 1, 2012
2.42 mln
+150.0K
6.61%
jan 1, 2013
3.41 mln
+990.0K
40.91%
jan 1, 2014
3.26 mln
-150.0K
-4.4%
jan 1, 2015
3.02 mln
-240.0K
-7.36%
Ranking of countries by current statistics by years