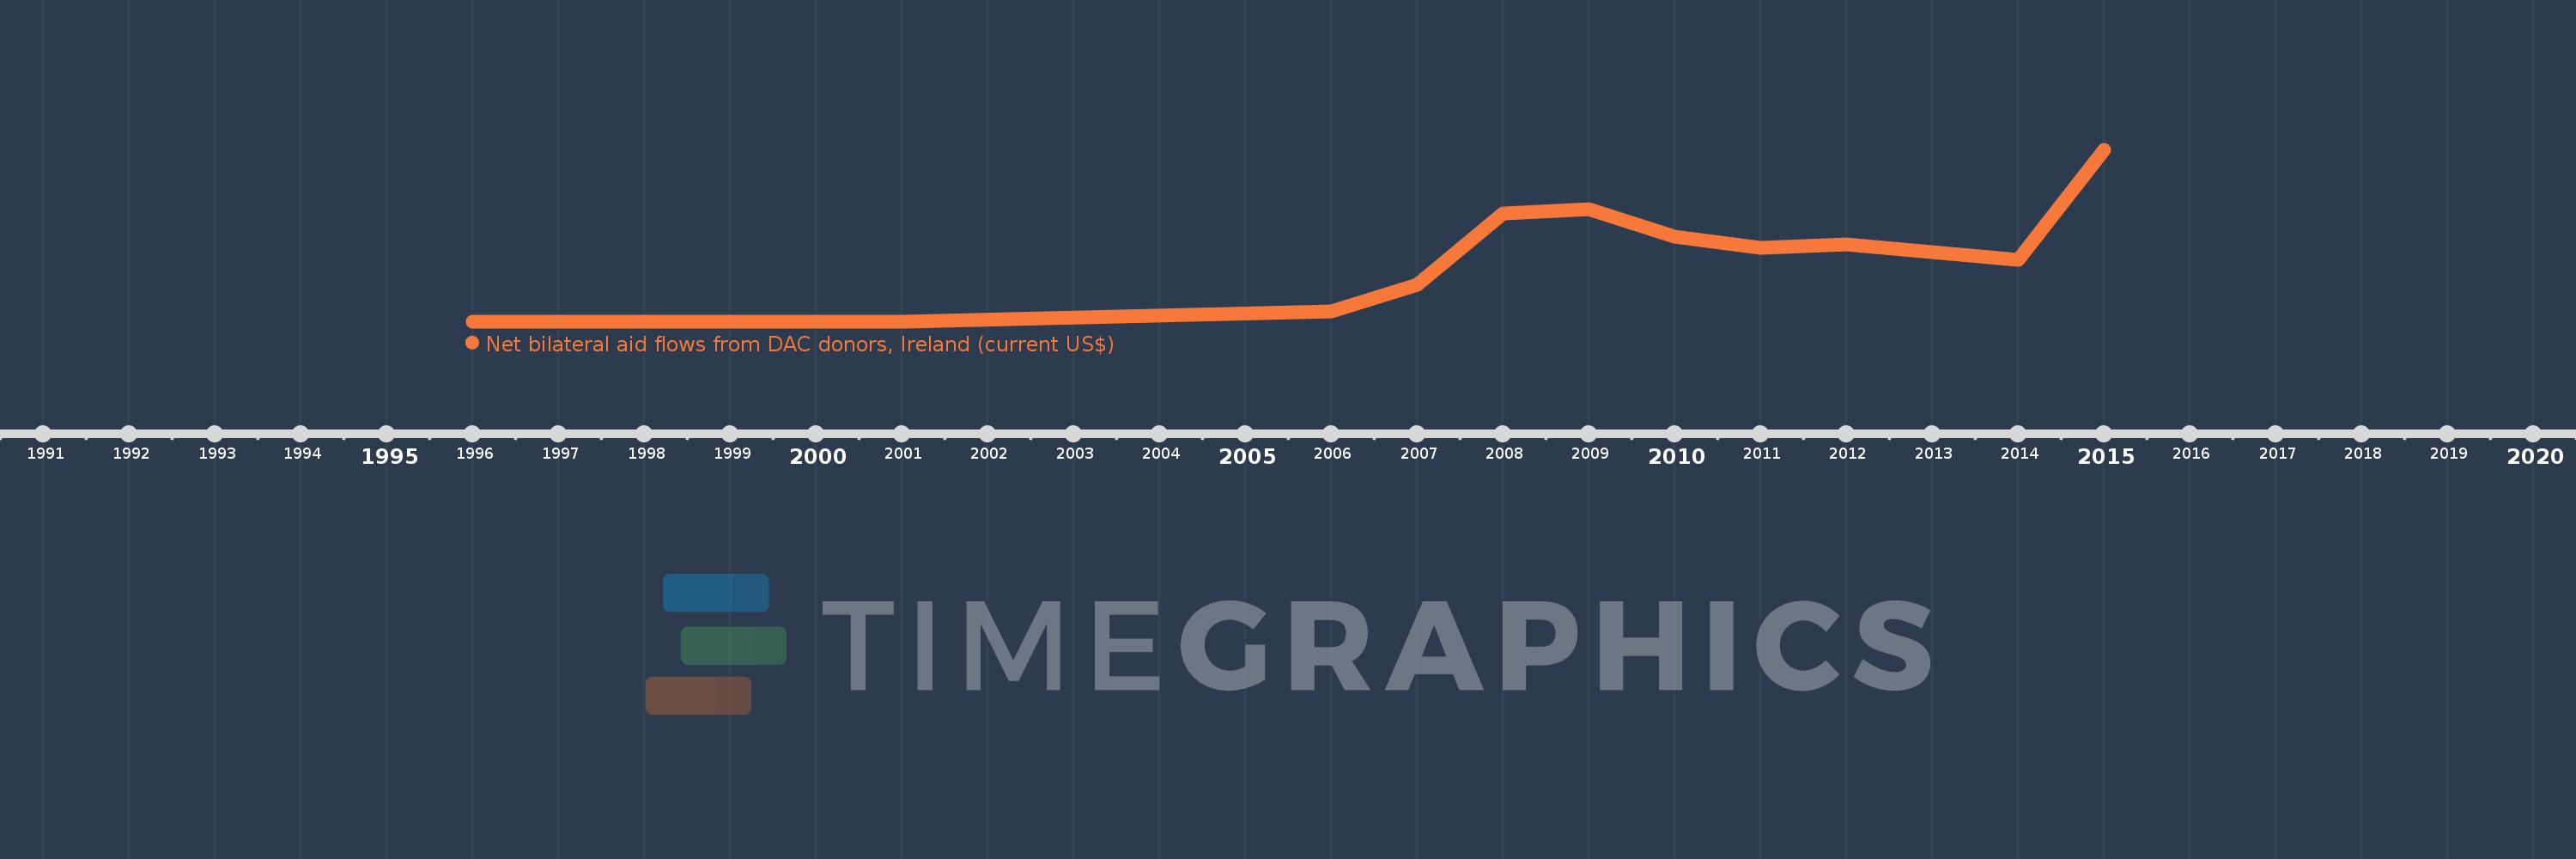
This timeline shows a graph from 1996 to 2015 of Central African Republic. No data until 1995. Number of actual observations by date: 15.
Source name:
World Development Indicators
Source organization:
Development Assistance Committee of the Organisation for Economic Co-operation and Development, Geographical Distribution of Financial Flows to Developing Countries, Development Co-operation Report, and International Development Statistics database. Data are available online at: www.oecd.org/dac/stats/idsonline.
Categories, topics:
Aid Effectiveness
Last updated:
apr 23, 2017
Indicators value changes by year
Meaning:
2.433 mln
Minimum:
10.0K
jan 1, 1996
Maximum:
7.7 mln
jan 1, 2015
At the date of observation
Value
Absolute change
Change from the previous value
jan 1, 1996
10.0K
+10.0K
0.0%
jan 1, 1997
20.0K
+10.0K
100.0%
jan 1, 1998
40.0K
+20.0K
100.0%
jan 1, 1999
30.0K
-10.0K
-25.0%
jan 1, 2001
20.0K
-10.0K
-33.33%
jan 1, 2006
500.0K
+480.0K
2.4K%
jan 1, 2007
1.69 mln
+1.19 mln
238.0%
jan 1, 2008
4.86 mln
+3.17 mln
187.57%
jan 1, 2009
5.05 mln
+190.0K
3.91%
jan 1, 2010
3.82 mln
-1.23 mln
-24.36%
jan 1, 2011
3.33 mln
-490.0K
-12.83%
jan 1, 2012
3.48 mln
+150.0K
4.5%
jan 1, 2013
3.15 mln
-330.0K
-9.48%
jan 1, 2014
2.79 mln
-360.0K
-11.43%
jan 1, 2015
7.7 mln
+4.91 mln
175.99%
Ranking of countries by current statistics by years