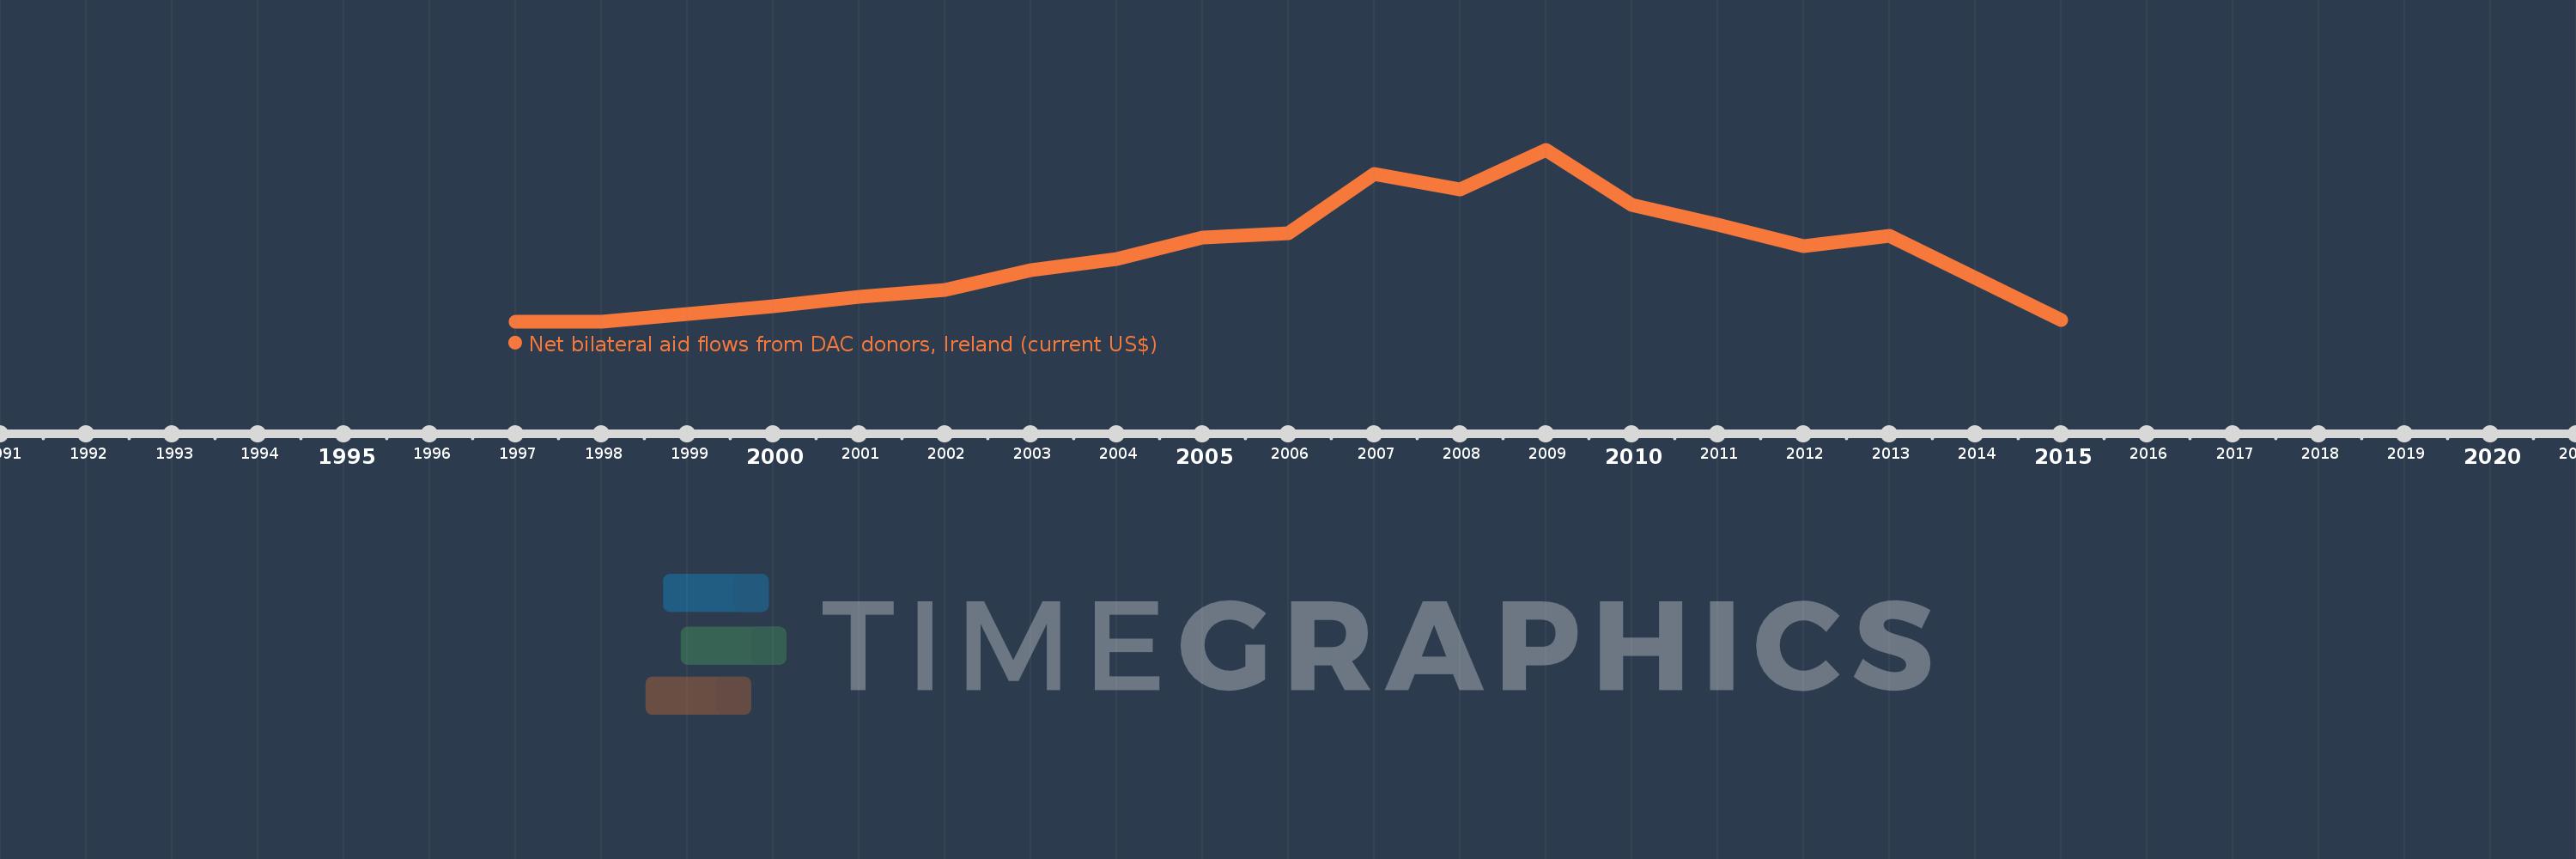
This timeline shows a graph from 1997 to 2015 of Timor-Leste. No data until 1996. Number of actual observations by date: 17.
Source name:
World Development Indicators
Source organization:
Development Assistance Committee of the Organisation for Economic Co-operation and Development, Geographical Distribution of Financial Flows to Developing Countries, Development Co-operation Report, and International Development Statistics database. Data are available online at: www.oecd.org/dac/stats/idsonline.
Categories, topics:
Aid Effectiveness
Last updated:
apr 23, 2017
Indicators value changes by year
Meaning:
4.426 mln
Minimum:
20.0K
jan 1, 1997
Maximum:
10.81 mln
jan 1, 2009
At the date of observation
Value
Absolute change
Change from the previous value
jan 1, 1997
20.0K
+20.0K
0.0%
jan 1, 1998
50.0K
+30.0K
150.0%
jan 1, 2000
1.03 mln
+980.0K
1.96K%
jan 1, 2001
1.6 mln
+570.0K
55.34%
jan 1, 2002
2.03 mln
+430.0K
26.88%
jan 1, 2003
3.25 mln
+1.22 mln
60.1%
jan 1, 2004
3.96 mln
+710.0K
21.85%
jan 1, 2005
5.33 mln
+1.37 mln
34.6%
jan 1, 2006
5.62 mln
+290.0K
5.44%
jan 1, 2007
9.32 mln
+3.7 mln
65.84%
jan 1, 2008
8.35 mln
-970.0K
-10.41%
jan 1, 2009
10.81 mln
+2.46 mln
29.46%
jan 1, 2010
7.37 mln
-3.44 mln
-31.82%
jan 1, 2011
6.15 mln
-1.22 mln
-16.55%
jan 1, 2012
4.78 mln
-1.37 mln
-22.28%
jan 1, 2013
5.43 mln
+650.0K
13.6%
jan 1, 2015
140.0K
-5.29 mln
-97.42%
Ranking of countries by current statistics by years