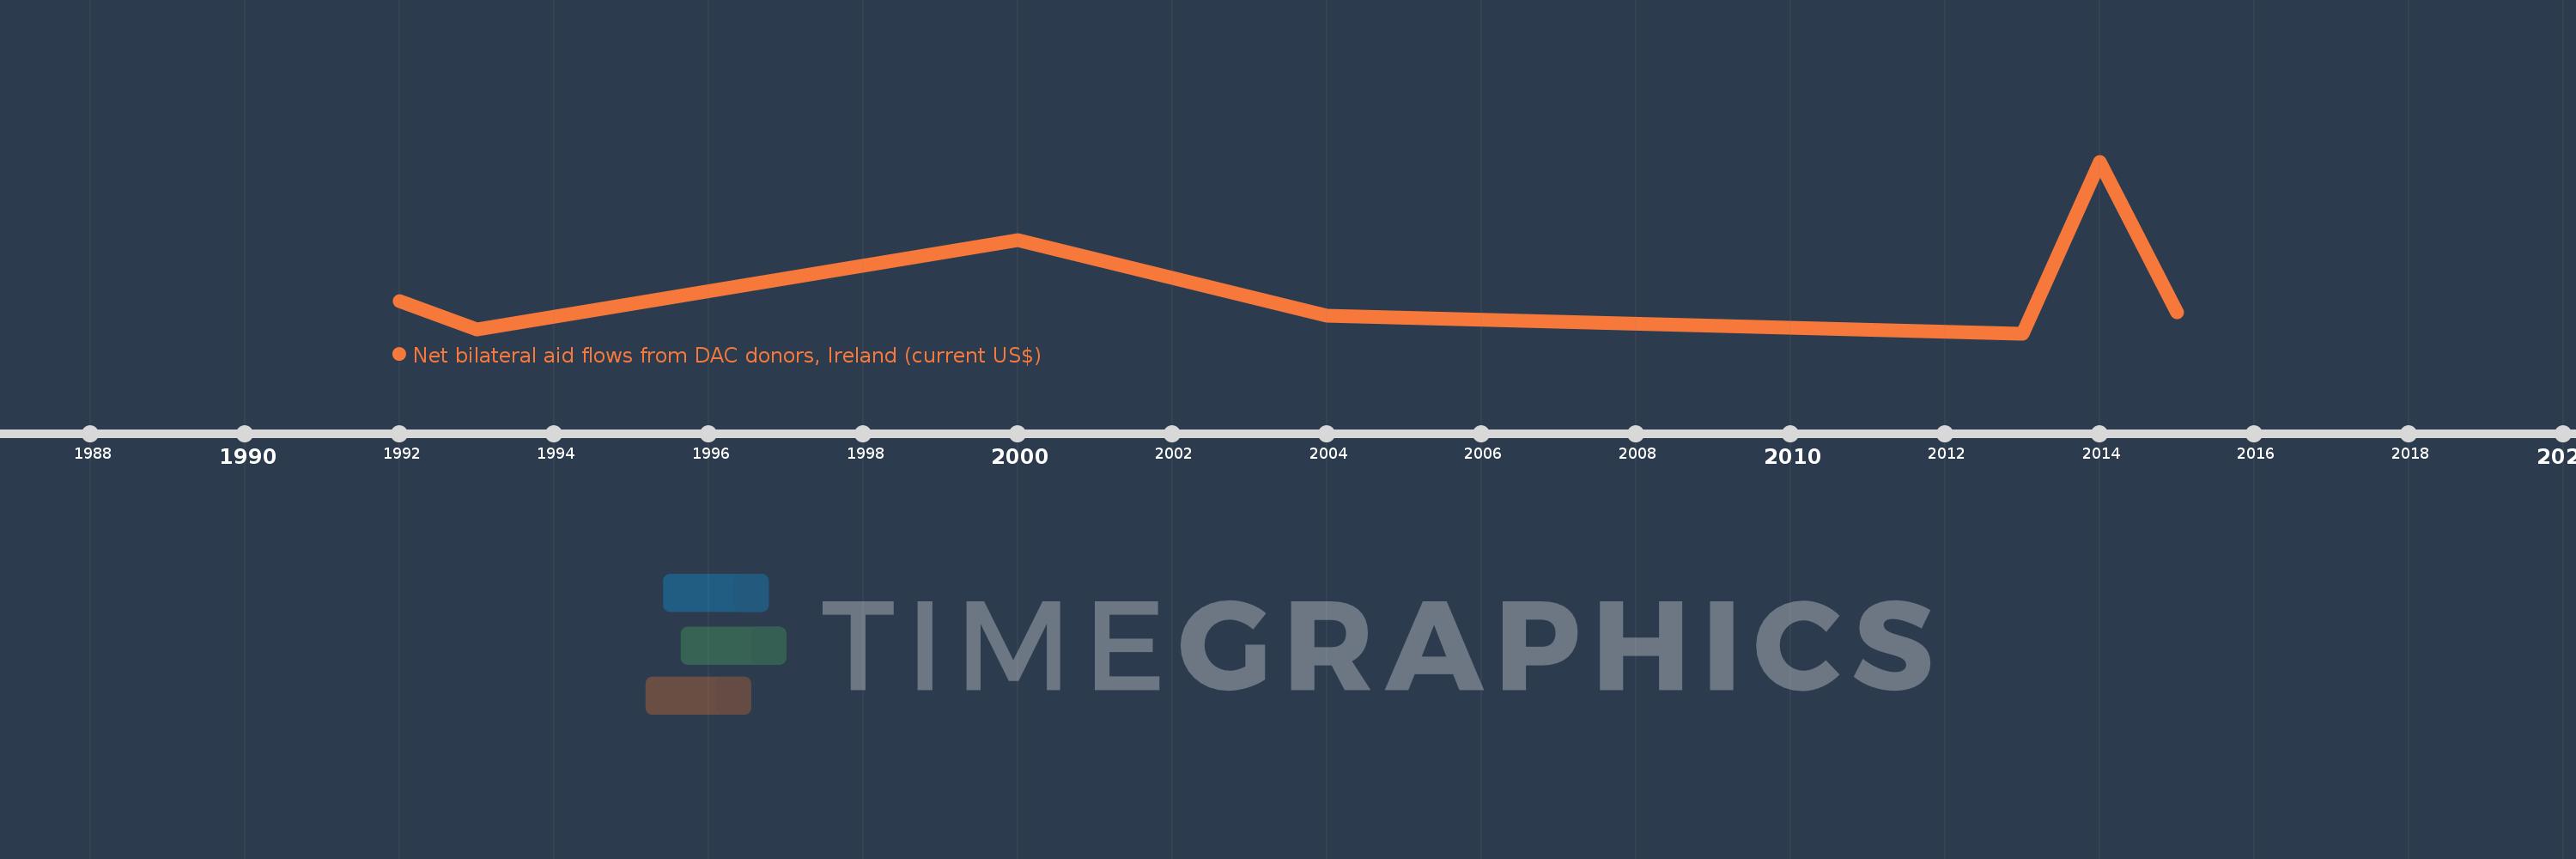
This timeline shows a graph from 1992 to 2015 of Turkey. No data until 1991. Number of actual observations by date: 7.
Source name:
World Development Indicators
Source organization:
Development Assistance Committee of the Organisation for Economic Co-operation and Development, Geographical Distribution of Financial Flows to Developing Countries, Development Co-operation Report, and International Development Statistics database. Data are available online at: www.oecd.org/dac/stats/idsonline.
Categories, topics:
Aid Effectiveness
Last updated:
apr 23, 2017
Indicators value changes by year
Meaning:
420.0K
Minimum:
10.0K
jan 1, 2013
Maximum:
1.46 mln
jan 1, 2014
At the date of observation
Value
Absolute change
Change from the previous value
jan 1, 1992
280.0K
+280.0K
0.0%
jan 1, 1993
40.0K
-240.0K
-85.71%
jan 1, 2000
800.0K
+760.0K
1.9K%
jan 1, 2004
160.0K
-640.0K
-80.0%
jan 1, 2013
10.0K
-150.0K
-93.75%
jan 1, 2014
1.46 mln
+1.45 mln
14.5K%
jan 1, 2015
190.0K
-1.27 mln
-86.99%
Ranking of countries by current statistics by years