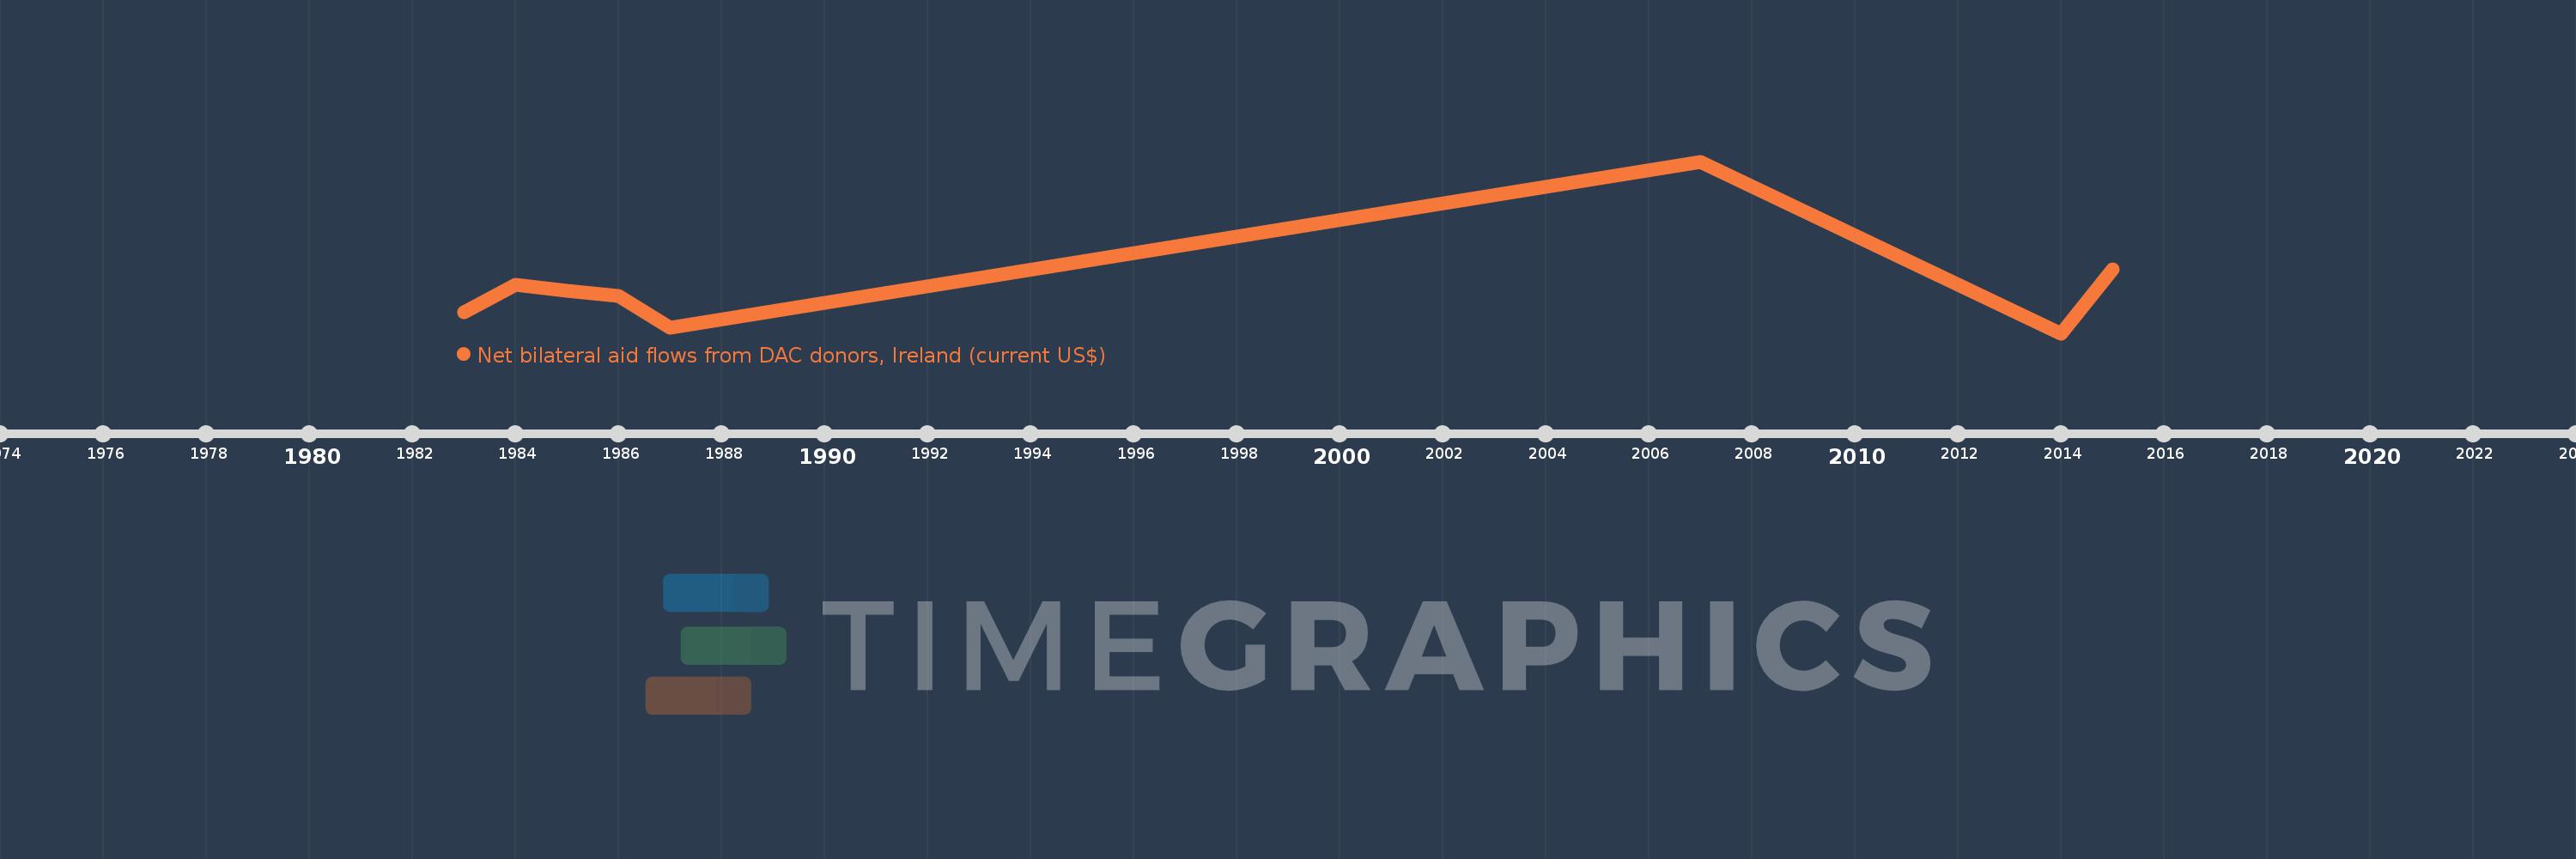
This timeline shows a graph from 1983 to 2015 of Djibouti. No data until 1982. Number of actual observations by date: 8.
Source name:
World Development Indicators
Source organization:
Development Assistance Committee of the Organisation for Economic Co-operation and Development, Geographical Distribution of Financial Flows to Developing Countries, Development Co-operation Report, and International Development Statistics database. Data are available online at: www.oecd.org/dac/stats/idsonline.
Categories, topics:
Aid Effectiveness
Last updated:
apr 23, 2017
Indicators value changes by year
Meaning:
151.25K
Minimum:
60.0K
jan 1, 2014
Maximum:
380.0K
jan 1, 2007
At the date of observation
Value
Absolute change
Change from the previous value
jan 1, 1983
100.0K
+100.0K
0.0%
jan 1, 1984
150.0K
+50.0K
50.0%
jan 1, 1985
140.0K
-10.0K
-6.67%
jan 1, 1986
130.0K
-10.0K
-7.14%
jan 1, 1987
70.0K
-60.0K
-46.15%
jan 1, 2007
380.0K
+310.0K
442.86%
jan 1, 2014
60.0K
-320.0K
-84.21%
jan 1, 2015
180.0K
+120.0K
200.0%
Ranking of countries by current statistics by years