33
/
AIzaSyAYiBZKx7MnpbEhh9jyipgxe19OcubqV5w
August 1, 2025
174430
Lao PDR
LAO
true
2
1
Net bilateral aid flows from DAC donors, Ireland (current US$)
2015,2014,2012,2011,2010,2009,2008,2007,2006,2005,2004,2003,2001,2000,1999,1998,1997,1996,1995,1994,1992
Download
Global statistics library →Lao PDR →

Net bilateral aid flows from DAC donors, Ireland (current US$)

This statistics in other country:

AfghanistanAlbaniaAlgeriaAngolaArab WorldArgentinaArmeniaAzerbaijanBangladeshBelarusBelizeBeninBhutanBoliviaBosnia and HerzegovinaBotswanaBrazilBulgariaBurkina FasoBurundiCambodiaCameroonCaribbean small statesCentral African RepublicCentral Europe and the BalticsChadChileChinaColombiaComorosCongo, Dem. Rep.Congo, Rep.Costa RicaCote d'IvoireCroatiaCubaCzech RepublicDjiboutiDominican RepublicEast Asia & PacificEast Asia & Pacific (excluding high income)East Asia & Pacific (IDA & IBRD countries)EcuadorEgypt, Arab Rep.El SalvadorEquatorial GuineaEritreaEthiopiaEuro areaEurope & Central AsiaEurope & Central Asia (excluding high income)Europe & Central Asia (IDA & IBRD countries)European UnionFijiFragile and conflict affected situationsGabonGambia, TheGeorgiaGhanaGrenadaGuatemalaGuineaGuinea-BissauGuyanaHaitiHeavily indebted poor countries (HIPC)High incomeHondurasHong Kong SAR, ChinaHungaryIBRD onlyIDA & IBRD totalIDA blendIDA onlyIDA totalIndiaIndonesiaIran, Islamic Rep.IraqIsraelJamaicaJordanKazakhstanKenyaKorea, Dem. People’s Rep.Korea, Rep.KosovoKyrgyz RepublicLao PDRLatin America & Caribbean Latin America & Caribbean (excluding high income)Latin America & the Caribbean (IDA & IBRD countries)LatviaLeast developed countries: UN classificationLebanonLesothoLiberiaLibyaLithuaniaLow & middle incomeLow incomeLower middle incomeMacedonia, FYRMadagascarMalawiMalaysiaMaldivesMaliMauritaniaMauritiusMexicoMicronesia, Fed. Sts.Middle East & North AfricaMiddle East & North Africa (excluding high income)Middle East & North Africa (IDA & IBRD countries)Middle incomeMoldovaMongoliaMontenegroMoroccoMozambiqueMyanmarNamibiaNepalNicaraguaNigerNigeriaOECD membersOther small statesPacific island small statesPakistanPanamaPapua New GuineaParaguayPeruPhilippinesPolandRomaniaRussian FederationRwandaSamoaSao Tome and PrincipeSenegalSerbiaSeychellesSierra LeoneSlovak RepublicSloveniaSmall statesSolomon IslandsSomaliaSouth AfricaSouth AsiaSouth Asia (IDA & IBRD)South SudanSri LankaSt. LuciaSub-Saharan Africa Sub-Saharan Africa (excluding high income)Sub-Saharan Africa (IDA & IBRD countries)SudanSurinameSwazilandSyrian Arab RepublicTajikistanTanzaniaThailandTimor-LesteTogoTrinidad and TobagoTunisiaTurkeyTurkmenistanUgandaUkraineUpper middle incomeUruguayUzbekistanVanuatuVenezuela, RBVietnamWest Bank and GazaWorldYemen, Rep.ZambiaZimbabwe

Timeline:

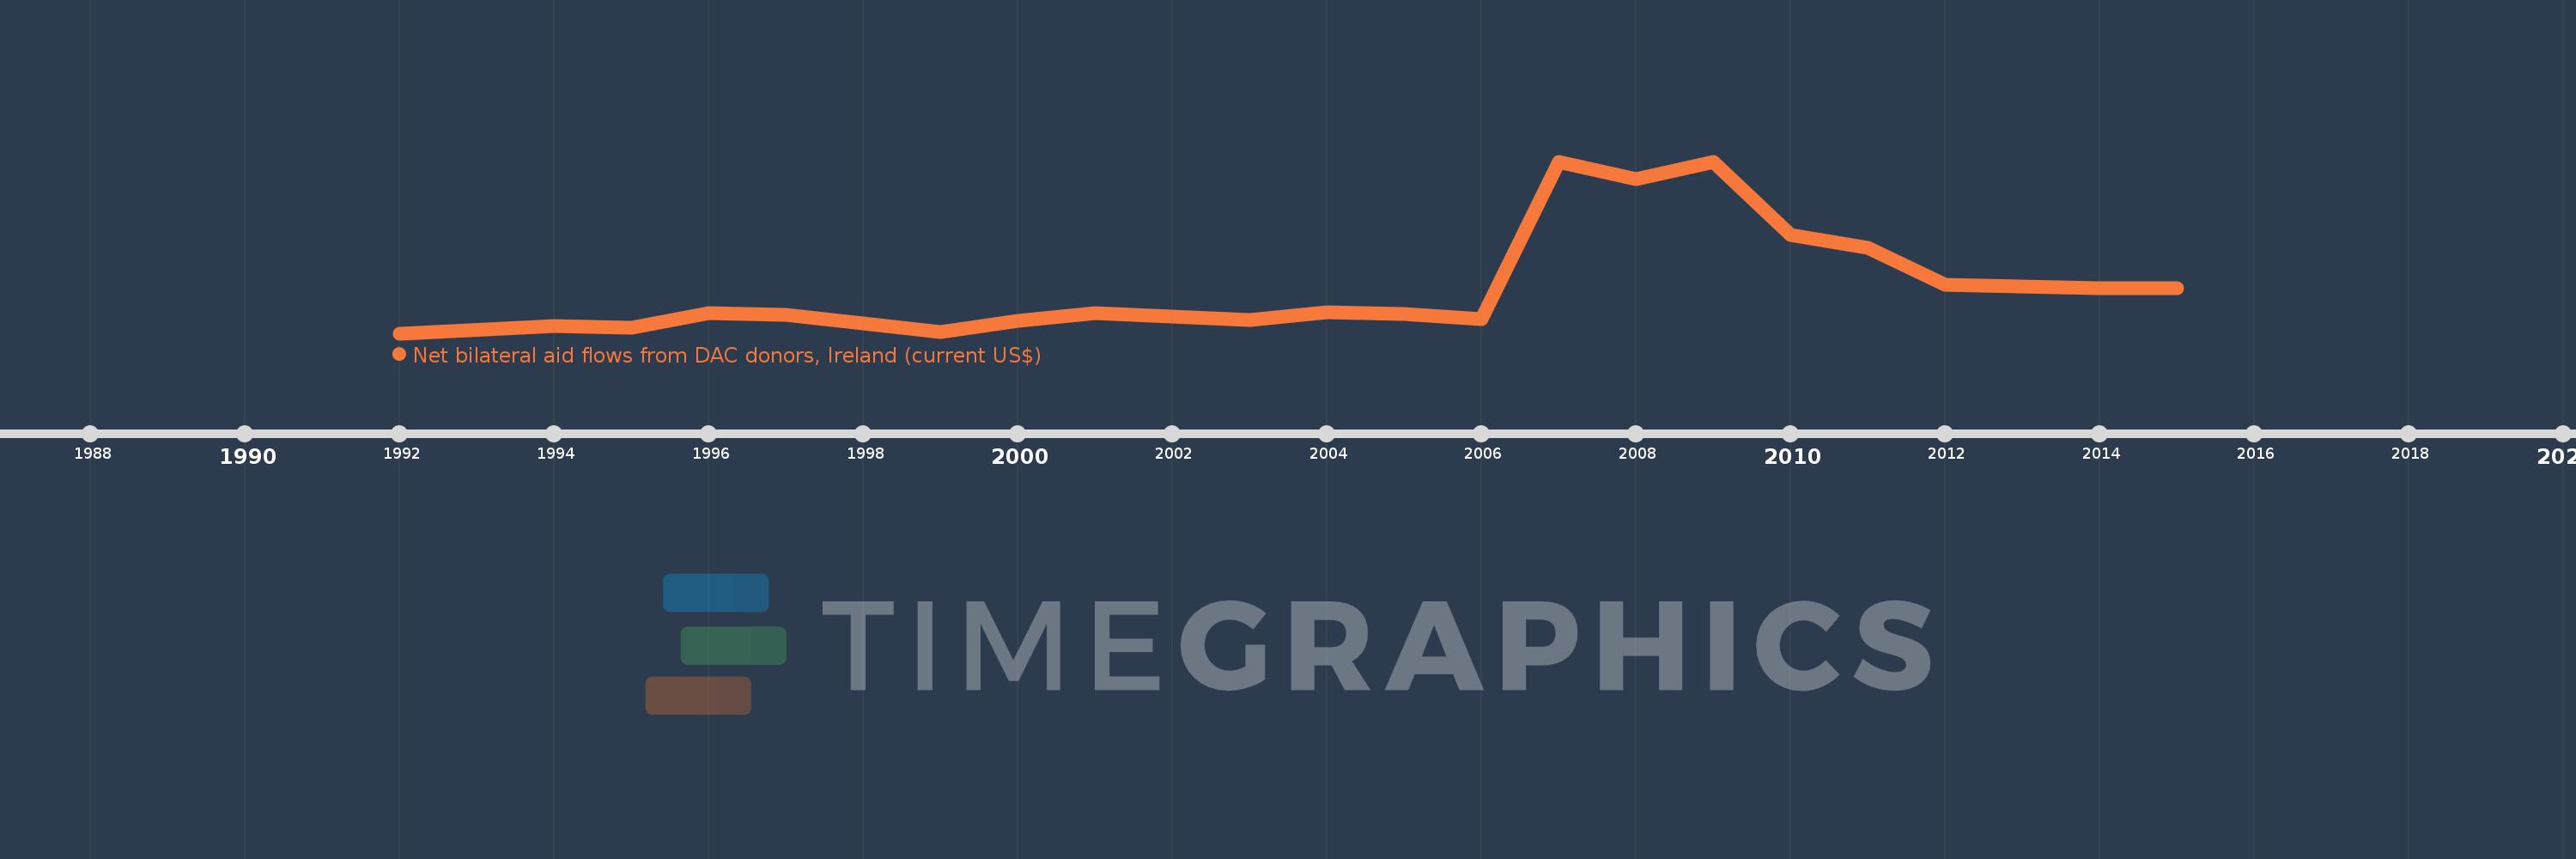
This timeline shows a graph from 1992 to 2015 of Lao PDR. No data until 1991. Number of actual observations by date: 21.

Source name:

World Development Indicators

Source organization:

Development Assistance Committee of the Organisation for Economic Co-operation and Development, Geographical Distribution of Financial Flows to Developing Countries, Development Co-operation Report, and International Development Statistics database. Data are available online at: www.oecd.org/dac/stats/idsonline.

Categories, topics:

Aid Effectiveness

Last updated:

apr 23, 2017

Indicators value changes by year

Meaning:
679.048K
Minimum:
20.0K
jan 1, 1992
Maximum:
2.44 mln
jan 1, 2009
At the date of observation
Value
Absolute change
Change from the previous value
jan 1, 1992
20.0K
+20.0K
0.0%
jan 1, 1994
120.0K
+100.0K
500.0%
jan 1, 1995
100.0K
-20.0K
-16.67%
jan 1, 1996
300.0K
+200.0K
200.0%
jan 1, 1997
280.0K
-20.0K
-6.67%
jan 1, 1998
160.0K
-120.0K
-42.86%
jan 1, 1999
40.0K
-120.0K
-75.0%
jan 1, 2000
190.0K
+150.0K
375.0%
jan 1, 2001
300.0K
+110.0K
57.89%
jan 1, 2003
210.0K
-90.0K
-30.0%
jan 1, 2004
320.0K
+110.0K
52.38%
jan 1, 2005
290.0K
-30.0K
-9.38%
jan 1, 2006
220.0K
-70.0K
-24.14%
jan 1, 2007
2.43 mln
+2.21 mln
1.0K%
jan 1, 2008
2.19 mln
-240.0K
-9.88%
jan 1, 2009
2.44 mln
+250.0K
11.42%
jan 1, 2010
1.41 mln
-1.03 mln
-42.21%
jan 1, 2011
1.22 mln
-190.0K
-13.48%
jan 1, 2012
700.0K
-520.0K
-42.62%
jan 1, 2014
660.0K
-40.0K
-5.71%
jan 1, 2015
660.0K
0.0
0.0%

Ranking of countries by current statistics by years