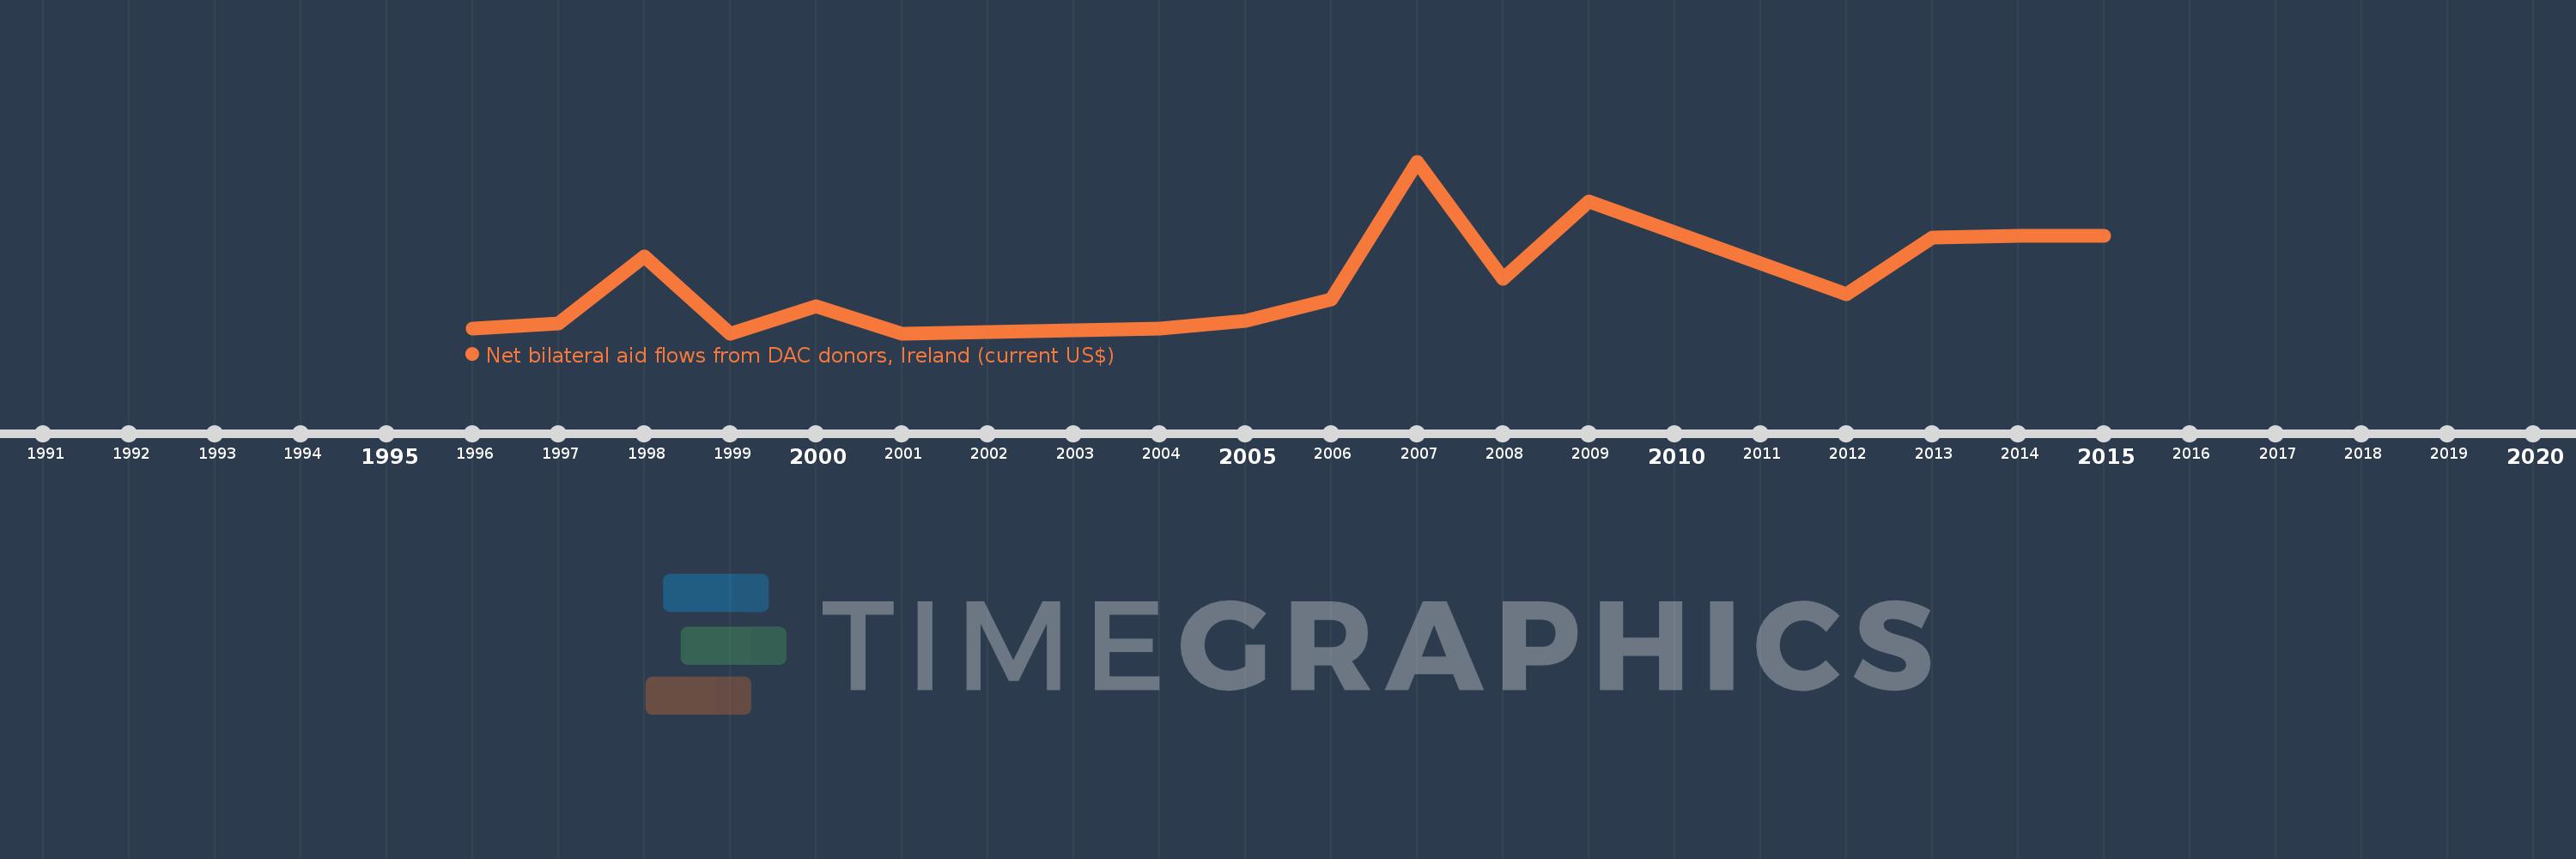
This timeline shows a graph from 1996 to 2015 of Korea, Dem. People’s Rep.. No data until 1995. Number of actual observations by date: 16.
Source name:
World Development Indicators
Source organization:
Development Assistance Committee of the Organisation for Economic Co-operation and Development, Geographical Distribution of Financial Flows to Developing Countries, Development Co-operation Report, and International Development Statistics database. Data are available online at: www.oecd.org/dac/stats/idsonline.
Categories, topics:
Aid Effectiveness
Last updated:
apr 23, 2017
Indicators value changes by year
Meaning:
478.75K
Minimum:
10.0K
jan 1, 1999
Maximum:
1.51 mln
jan 1, 2007
At the date of observation
Value
Absolute change
Change from the previous value
jan 1, 1996
50.0K
+50.0K
0.0%
jan 1, 1997
100.0K
+50.0K
100.0%
jan 1, 1998
680.0K
+580.0K
580.0%
jan 1, 1999
10.0K
-670.0K
-98.53%
jan 1, 2000
250.0K
+240.0K
2.4K%
jan 1, 2001
10.0K
-240.0K
-96.0%
jan 1, 2004
50.0K
+40.0K
400.0%
jan 1, 2005
120.0K
+70.0K
140.0%
jan 1, 2006
310.0K
+190.0K
158.33%
jan 1, 2007
1.51 mln
+1.2 mln
387.1%
jan 1, 2008
490.0K
-1.02 mln
-67.55%
jan 1, 2009
1.16 mln
+670.0K
136.73%
jan 1, 2012
350.0K
-810.0K
-69.83%
jan 1, 2013
850.0K
+500.0K
142.86%
jan 1, 2014
860.0K
+10.0K
1.18%
jan 1, 2015
860.0K
0.0
0.0%
Ranking of countries by current statistics by years