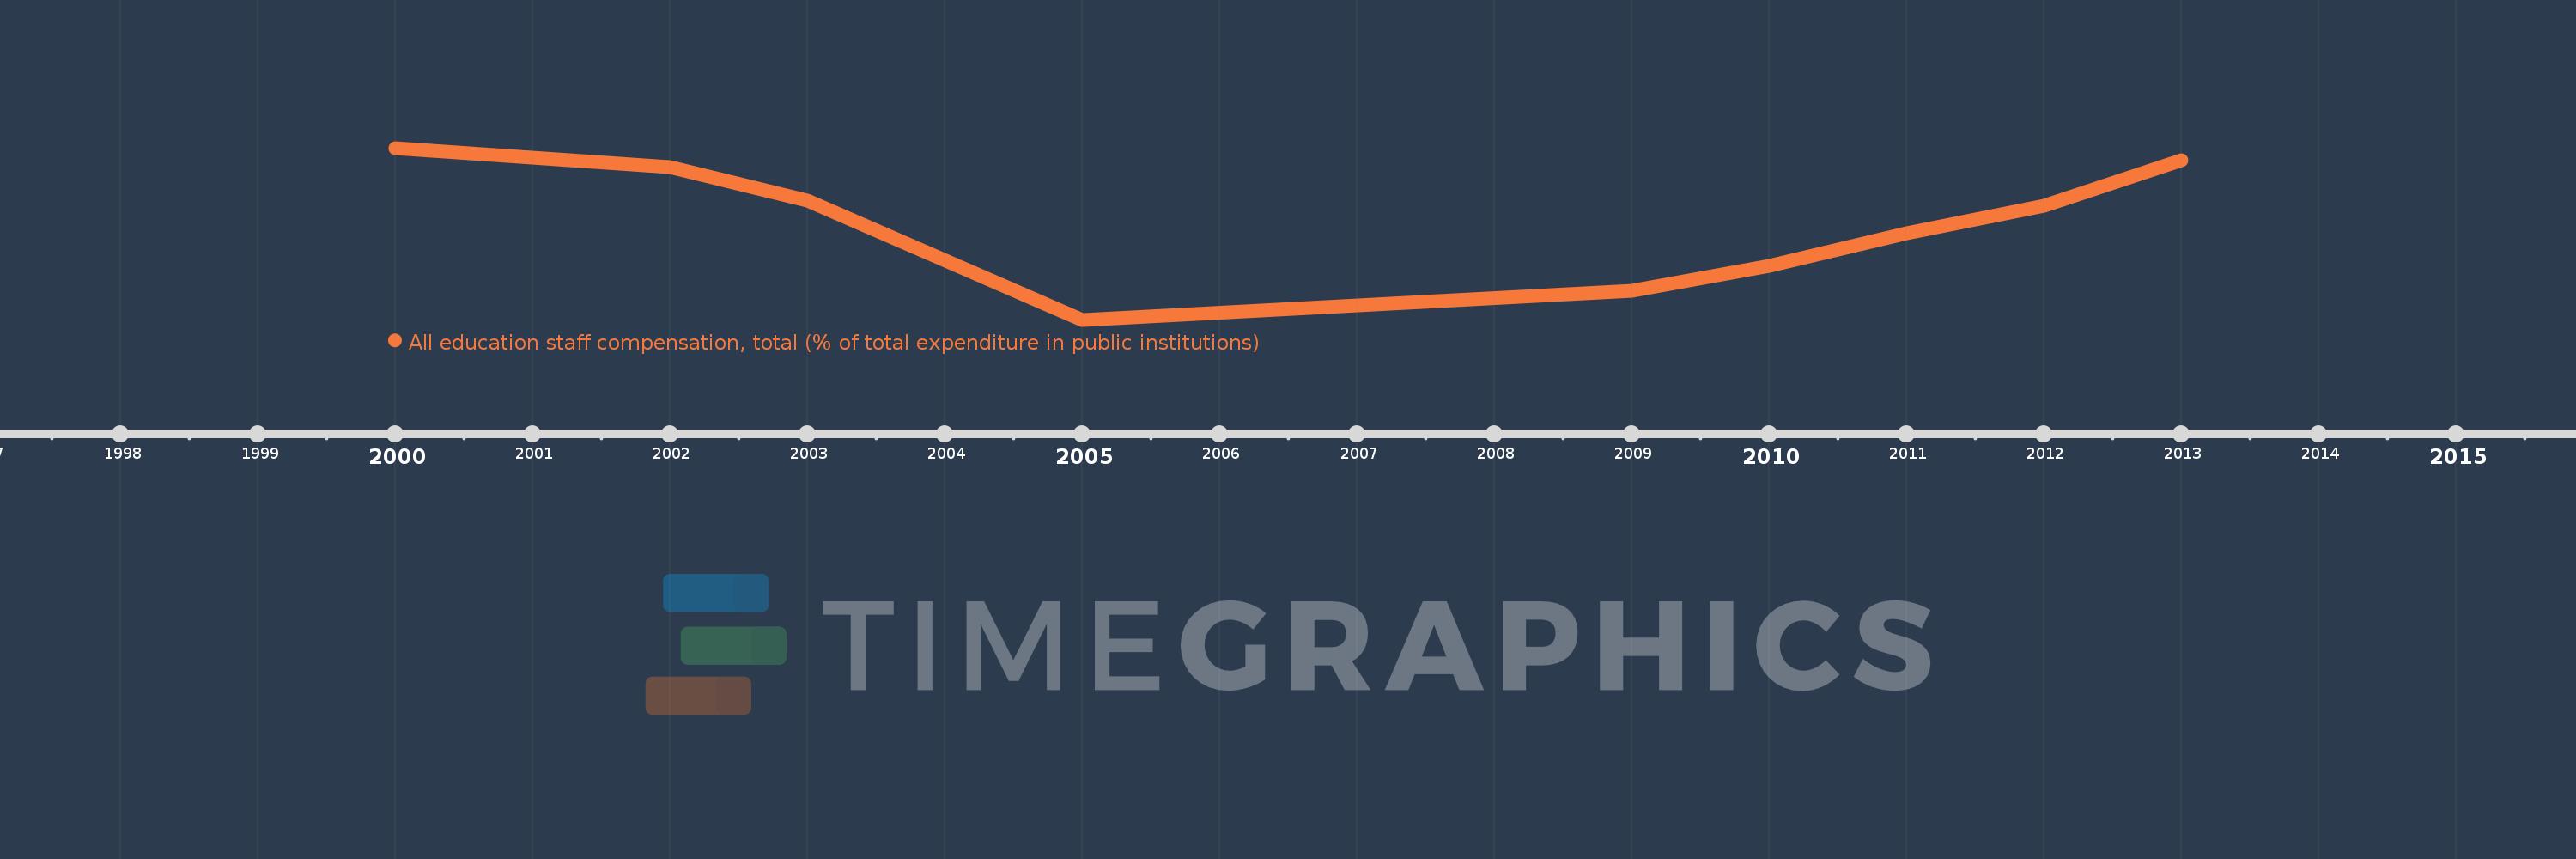
Questa scala temporale mostra un grafico dal 2000 anno al 2013 anno. Burundi. I dati fino ad 1999 anno non disponibili. Il numero di osservazioni attuali secondo i date: 9.
La fonte (nome):
Indicatori dello sviluppo mondiale
La fonte (organizzazione):
United Nations Educational, Scientific, and Cultural Organization (UNESCO) Institute for Statistics.
Categorie:
Education
sono stati aggiornati
23 apr 2017 anni
Indicatori delle variazioni dei valori per anni
In media:
70.012
Minima:
57.783
1 gen 2005 anni
Massimo:
79.116
1 gen 2000 anni
Alla data di osservazione
Valore
Variazione assoluta
La variazione rispetto al valore precedente
1 gen 2000 anni
79.116
+79.116
0.0%
1 gen 2002 anni
76.724
-2.392
-3.02%
1 gen 2003 anni
72.619
-4.105
-5.35%
1 gen 2005 anni
57.783
-14.836
-20.43%
1 gen 2009 anni
61.426
+3.643
6.3%
1 gen 2010 anni
64.443
+3.017
4.91%
1 gen 2011 anni
68.479
+4.036
6.26%
1 gen 2012 anni
71.936
+3.457
5.05%
1 gen 2013 anni
77.586
+5.65
7.85%
Classificazione dei paesi secondo i statistiche attuali per anni