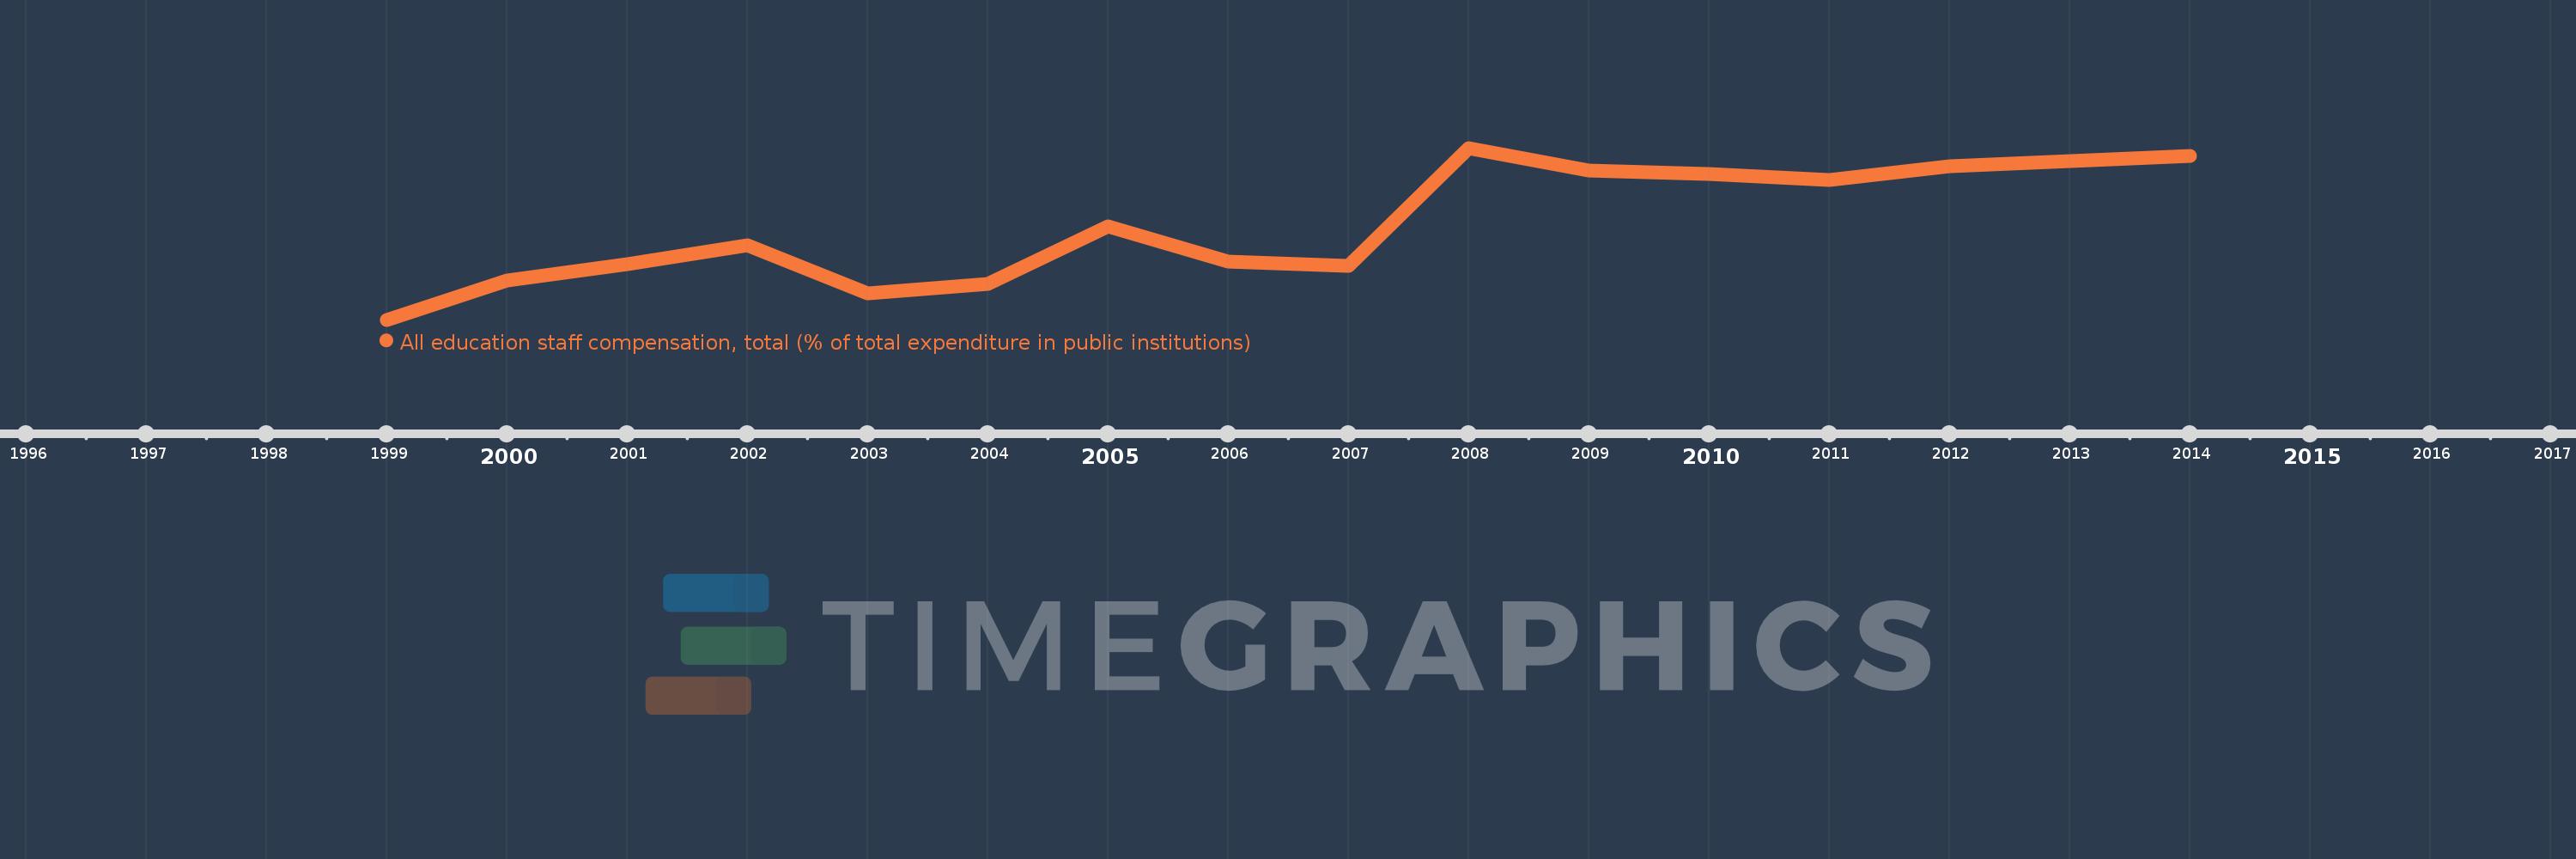
Questa scala temporale mostra un grafico dal 1999 anno al 2014 anno. Israel. I dati fino ad 1998 anno non disponibili. Il numero di osservazioni attuali secondo i date: 15.
La fonte (nome):
Indicatori dello sviluppo mondiale
La fonte (organizzazione):
United Nations Educational, Scientific, and Cultural Organization (UNESCO) Institute for Statistics.
Categorie:
Education
sono stati aggiornati
23 apr 2017 anni
Indicatori delle variazioni dei valori per anni
In media:
70.427
Minima:
65.798
1 gen 1999 anni
Massimo:
74.56
1 gen 2008 anni
Alla data di osservazione
Valore
Variazione assoluta
La variazione rispetto al valore precedente
1 gen 1999 anni
65.798
+65.798
0.0%
1 gen 2000 anni
67.812
+2.014
3.06%
1 gen 2001 anni
68.644
+0.832
1.23%
1 gen 2002 anni
69.618
+0.974
1.42%
1 gen 2003 anni
67.14
-2.478
-3.56%
1 gen 2004 anni
67.607
+0.467
0.7%
1 gen 2005 anni
70.577
+2.97
4.39%
1 gen 2006 anni
68.751
-1.826
-2.59%
1 gen 2007 anni
68.562
-0.189
-0.28%
1 gen 2008 anni
74.56
+5.998
8.75%
1 gen 2009 anni
73.396
-1.164
-1.56%
1 gen 2010 anni
73.244
-0.152
-0.21%
1 gen 2011 anni
72.928
-0.317
-0.43%
1 gen 2012 anni
73.608
+0.681
0.93%
1 gen 2014 anni
74.164
+0.555
0.75%
Classificazione dei paesi secondo i statistiche attuali per anni