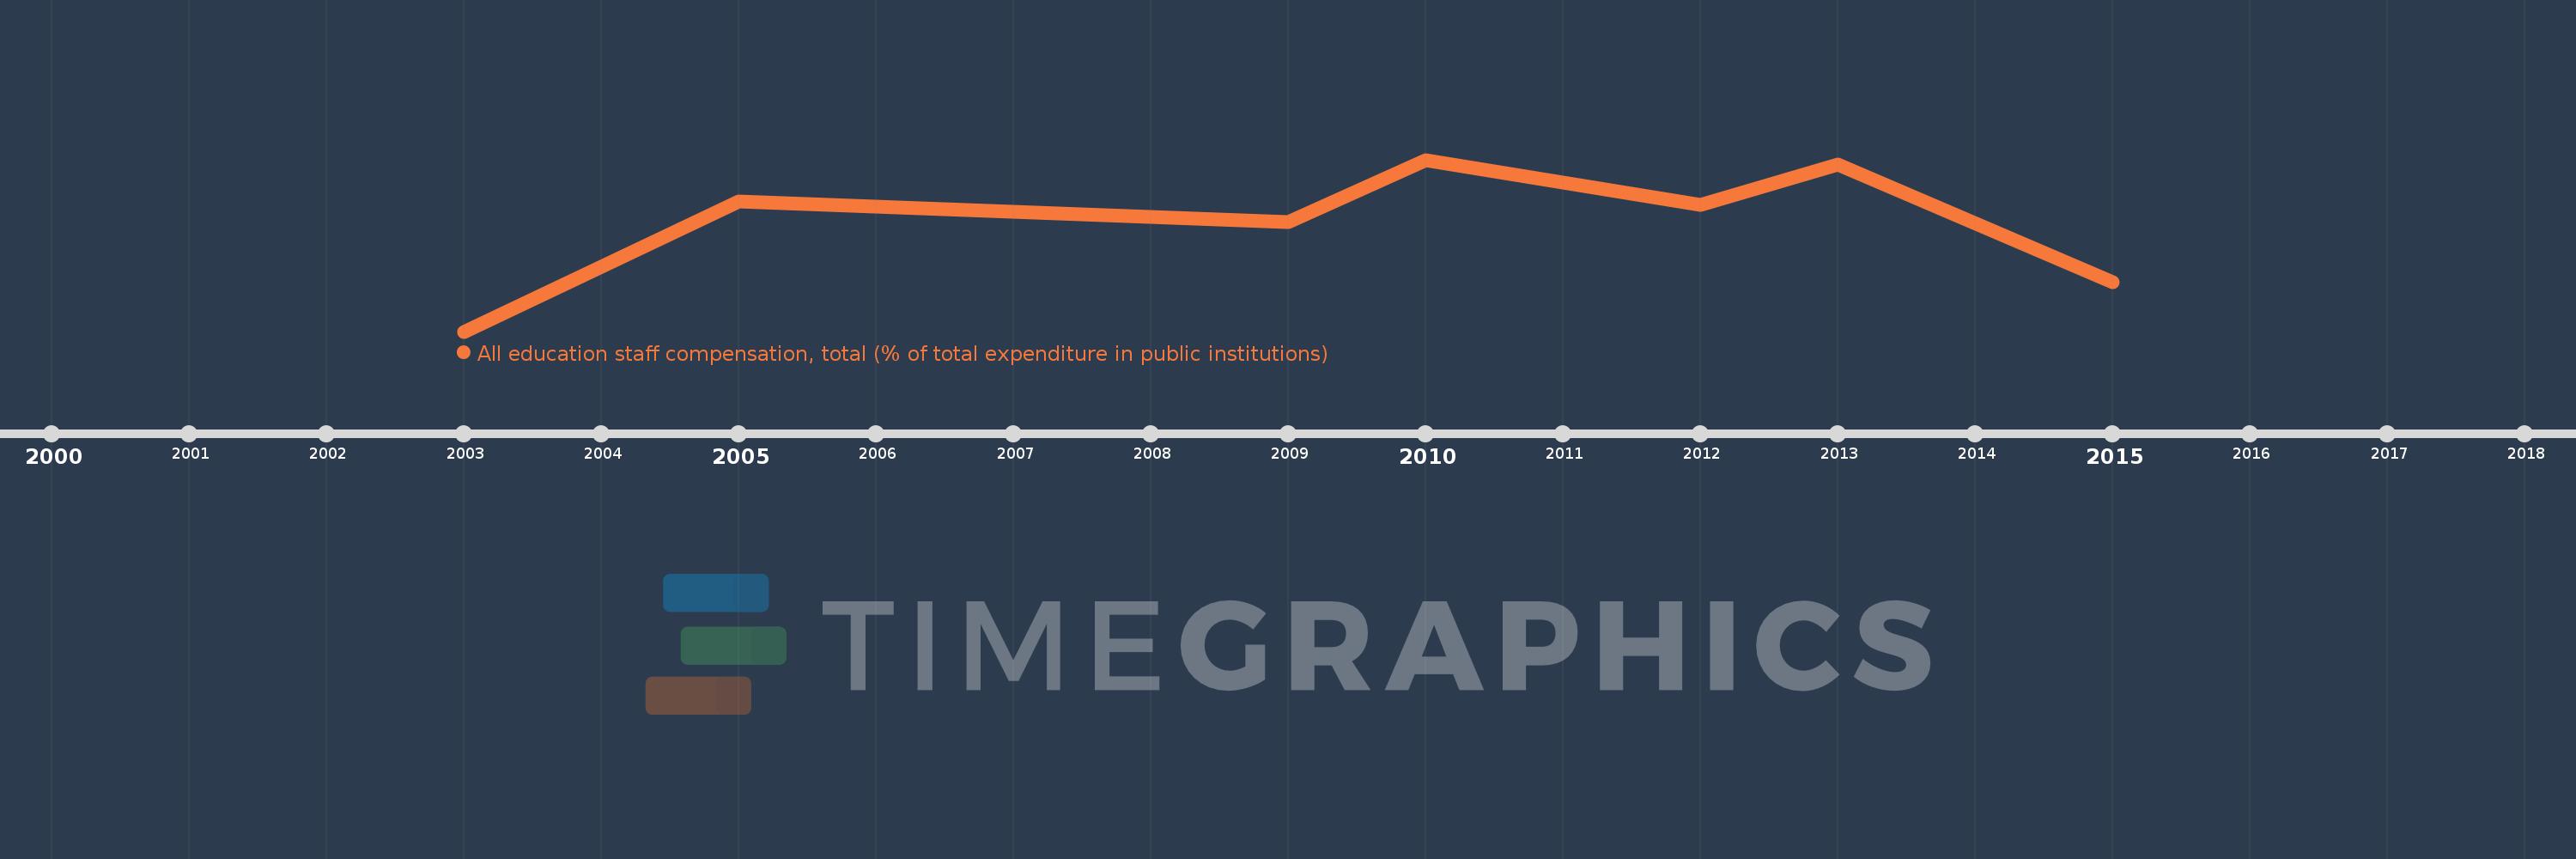
Questa scala temporale mostra un grafico dal 2003 anno al 2015 anno. Jamaica. I dati fino ad 2002 anno non disponibili. Il numero di osservazioni attuali secondo i date: 7.
La fonte (nome):
Indicatori dello sviluppo mondiale
La fonte (organizzazione):
United Nations Educational, Scientific, and Cultural Organization (UNESCO) Institute for Statistics.
Categorie:
Education
sono stati aggiornati
23 apr 2017 anni
Indicatori delle variazioni dei valori per anni
In media:
85.427
Minima:
72.599
1 gen 2003 anni
Massimo:
93.028
1 gen 2010 anni
Alla data di osservazione
Valore
Variazione assoluta
La variazione rispetto al valore precedente
1 gen 2003 anni
72.599
+72.599
0.0%
1 gen 2005 anni
88.077
+15.478
21.32%
1 gen 2009 anni
85.65
-2.427
-2.76%
1 gen 2010 anni
93.028
+7.378
8.61%
1 gen 2012 anni
87.694
-5.333
-5.73%
1 gen 2013 anni
92.427
+4.733
5.4%
1 gen 2015 anni
78.511
-13.916
-15.06%
Classificazione dei paesi secondo i statistiche attuali per anni