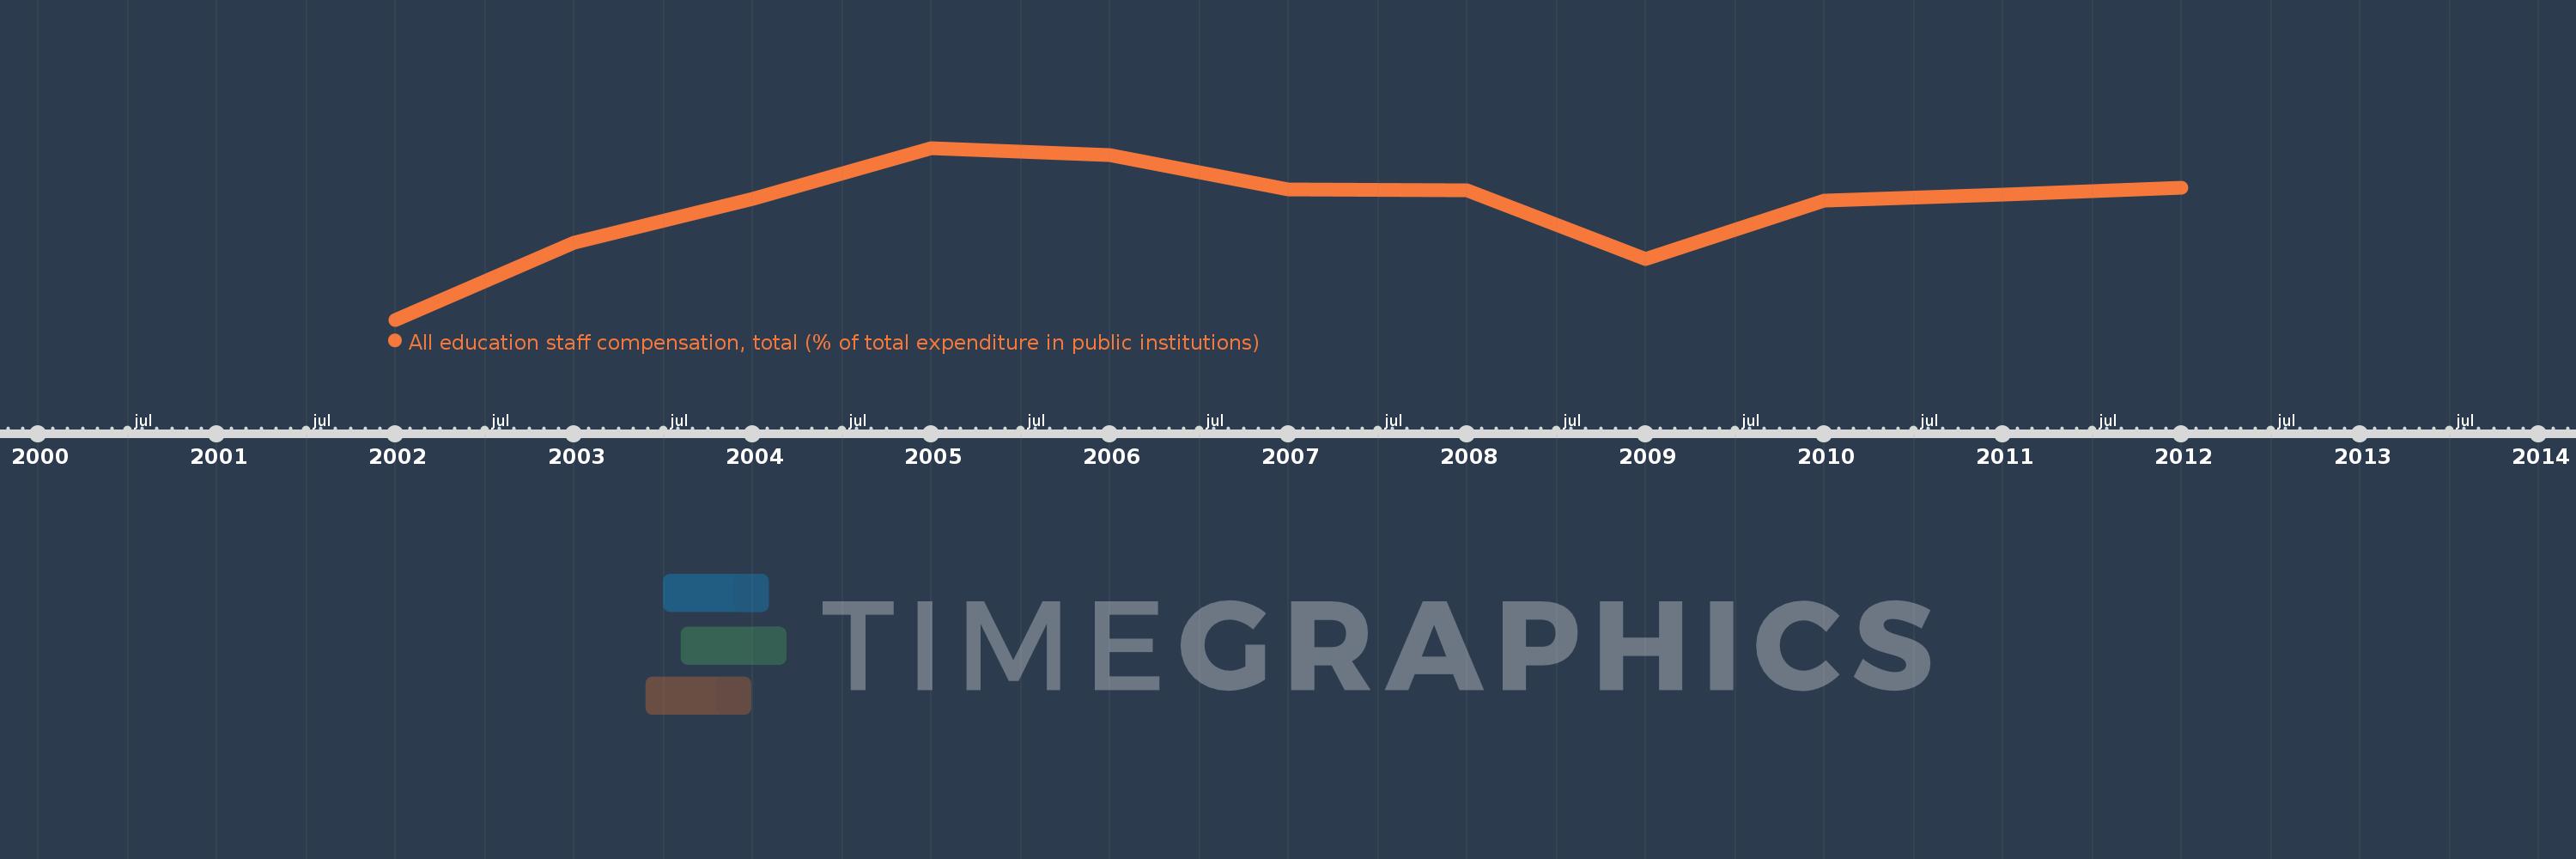
Questa scala temporale mostra un grafico dal 2002 anno al 2012 anno. Belgium. I dati fino ad 2001 anno non disponibili. Il numero di osservazioni attuali secondo i date: 11.
La fonte (nome):
Indicatori dello sviluppo mondiale
La fonte (organizzazione):
United Nations Educational, Scientific, and Cultural Organization (UNESCO) Institute for Statistics.
Categorie:
Education
sono stati aggiornati
23 apr 2017 anni
Indicatori delle variazioni dei valori per anni
In media:
83.884
Minima:
80.496
1 gen 2002 anni
Massimo:
85.696
1 gen 2005 anni
Alla data di osservazione
Valore
Variazione assoluta
La variazione rispetto al valore precedente
1 gen 2002 anni
80.496
+80.496
0.0%
1 gen 2003 anni
82.834
+2.338
2.9%
1 gen 2004 anni
84.161
+1.326
1.6%
1 gen 2005 anni
85.696
+1.535
1.82%
1 gen 2006 anni
85.487
-0.209
-0.24%
1 gen 2007 anni
84.445
-1.042
-1.22%
1 gen 2008 anni
84.419
-0.027
-0.03%
1 gen 2009 anni
82.327
-2.092
-2.48%
1 gen 2010 anni
84.097
+1.77
2.15%
1 gen 2011 anni
84.284
+0.186
0.22%
1 gen 2012 anni
84.484
+0.2
0.24%
Classificazione dei paesi secondo i statistiche attuali per anni