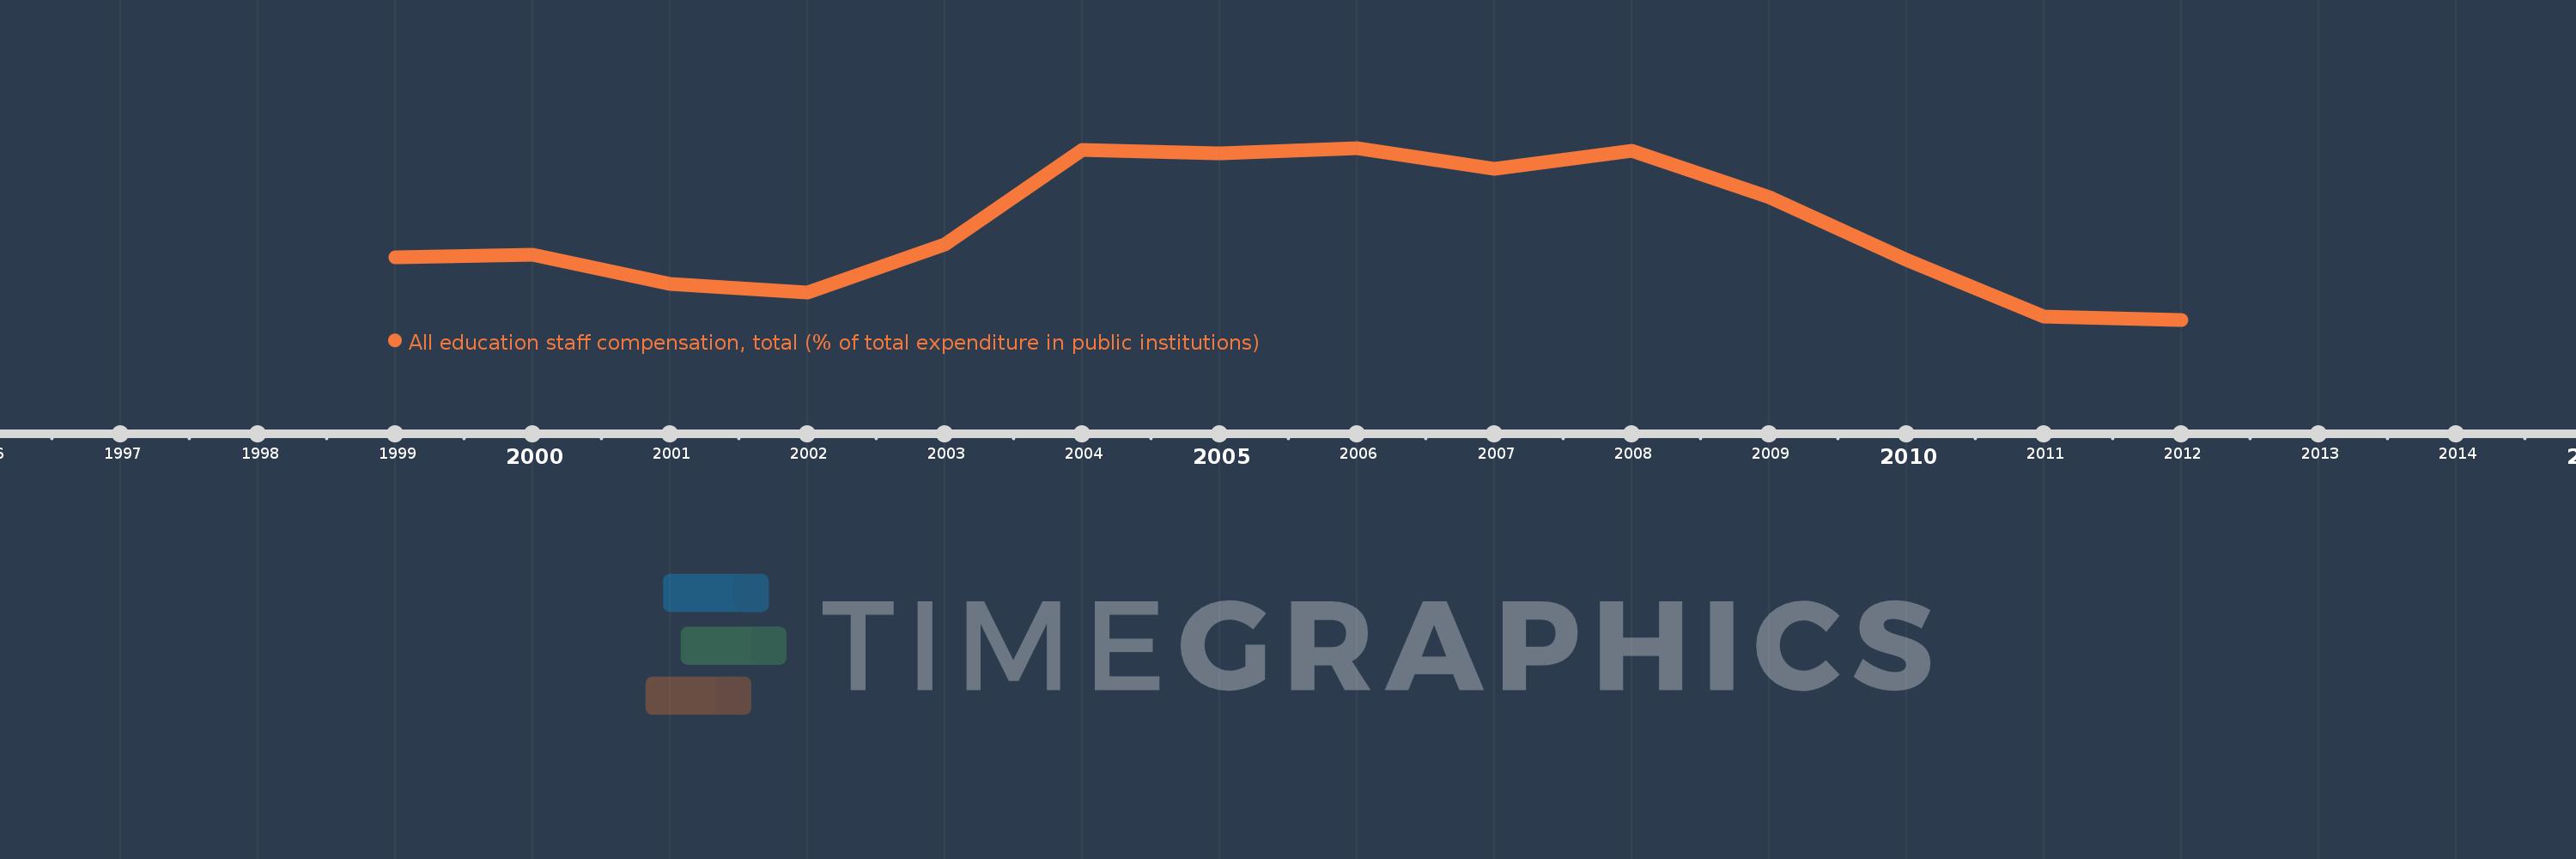
Questa scala temporale mostra un grafico dal 1999 anno al 2012 anno. Hungary. I dati fino ad 1998 anno non disponibili. Il numero di osservazioni attuali secondo i date: 14.
La fonte (nome):
Indicatori dello sviluppo mondiale
La fonte (organizzazione):
United Nations Educational, Scientific, and Cultural Organization (UNESCO) Institute for Statistics.
Categorie:
Education
sono stati aggiornati
23 apr 2017 anni
Indicatori delle variazioni dei valori per anni
In media:
67.279
Minima:
62.319
1 gen 2012 anni
Massimo:
71.642
1 gen 2006 anni
Alla data di osservazione
Valore
Variazione assoluta
La variazione rispetto al valore precedente
1 gen 1999 anni
65.711
+65.711
0.0%
1 gen 2000 anni
65.87
+0.159
0.24%
1 gen 2001 anni
64.261
-1.609
-2.44%
1 gen 2002 anni
63.782
-0.479
-0.75%
1 gen 2003 anni
66.39
+2.608
4.09%
1 gen 2004 anni
71.517
+5.126
7.72%
1 gen 2005 anni
71.355
-0.161
-0.23%
1 gen 2006 anni
71.642
+0.287
0.4%
1 gen 2007 anni
70.494
-1.148
-1.6%
1 gen 2008 anni
71.508
+1.013
1.44%
1 gen 2009 anni
68.971
-2.537
-3.55%
1 gen 2010 anni
65.59
-3.381
-4.9%
1 gen 2011 anni
62.498
-3.091
-4.71%
1 gen 2012 anni
62.319
-0.18
-0.29%
Classificazione dei paesi secondo i statistiche attuali per anni