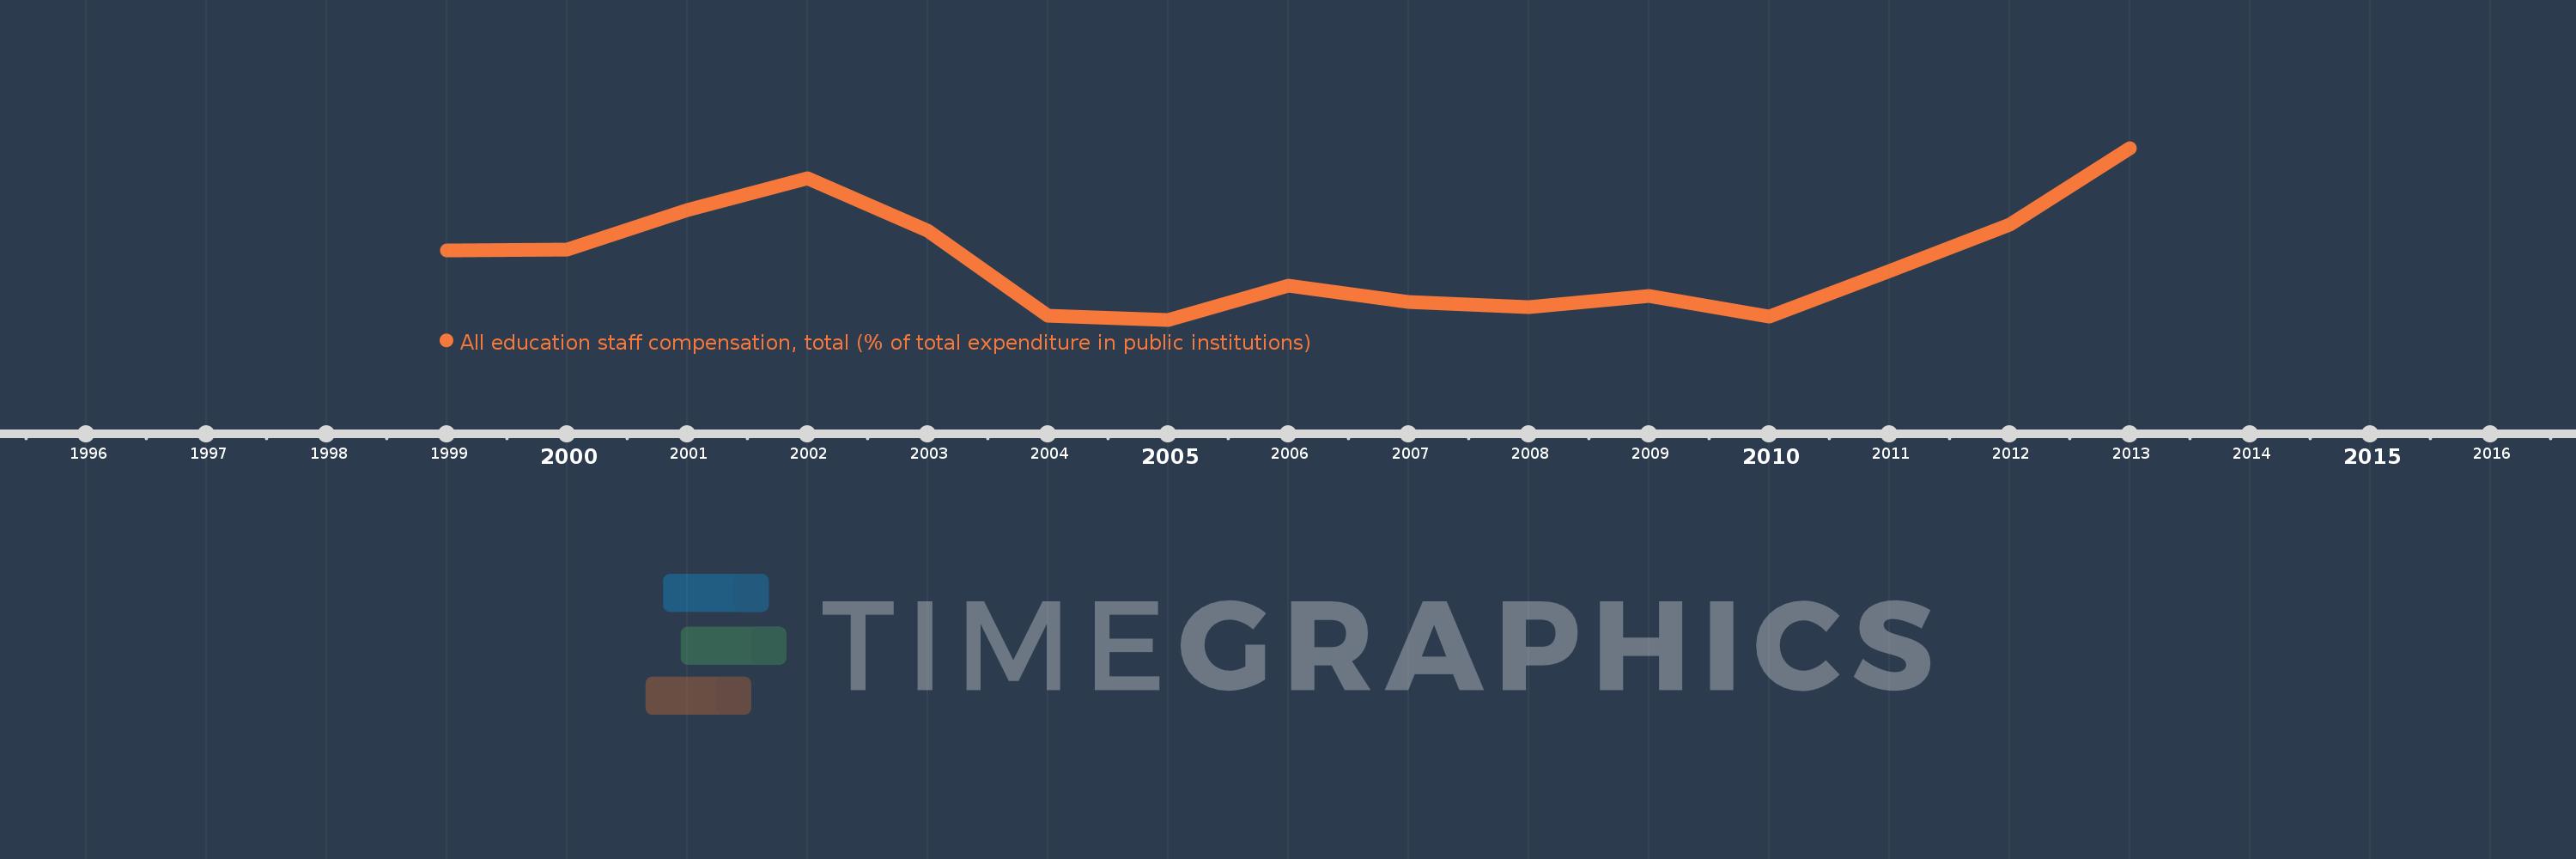
Questa scala temporale mostra un grafico dal 1999 anno al 2013 anno. Norway. I dati fino ad 1998 anno non disponibili. Il numero di osservazioni attuali secondo i date: 15.
La fonte (nome):
Indicatori dello sviluppo mondiale
La fonte (organizzazione):
United Nations Educational, Scientific, and Cultural Organization (UNESCO) Institute for Statistics.
Categorie:
Education
sono stati aggiornati
23 apr 2017 anni
Indicatori delle variazioni dei valori per anni
In media:
67.79
Minima:
65.785
1 gen 2005 anni
Massimo:
71.581
1 gen 2013 anni
Alla data di osservazione
Valore
Variazione assoluta
La variazione rispetto al valore precedente
1 gen 1999 anni
68.135
+68.135
0.0%
1 gen 2000 anni
68.156
+0.021
0.03%
1 gen 2001 anni
69.484
+1.327
1.95%
1 gen 2002 anni
70.548
+1.065
1.53%
1 gen 2003 anni
68.791
-1.758
-2.49%
1 gen 2004 anni
65.925
-2.866
-4.17%
1 gen 2005 anni
65.785
-0.139
-0.21%
1 gen 2006 anni
66.943
+1.157
1.76%
1 gen 2007 anni
66.391
-0.552
-0.82%
1 gen 2008 anni
66.21
-0.181
-0.27%
1 gen 2009 anni
66.601
+0.391
0.59%
1 gen 2010 anni
65.893
-0.708
-1.06%
1 gen 2011 anni
67.424
+1.532
2.32%
1 gen 2012 anni
68.985
+1.561
2.32%
1 gen 2013 anni
71.581
+2.595
3.76%
Classificazione dei paesi secondo i statistiche attuali per anni