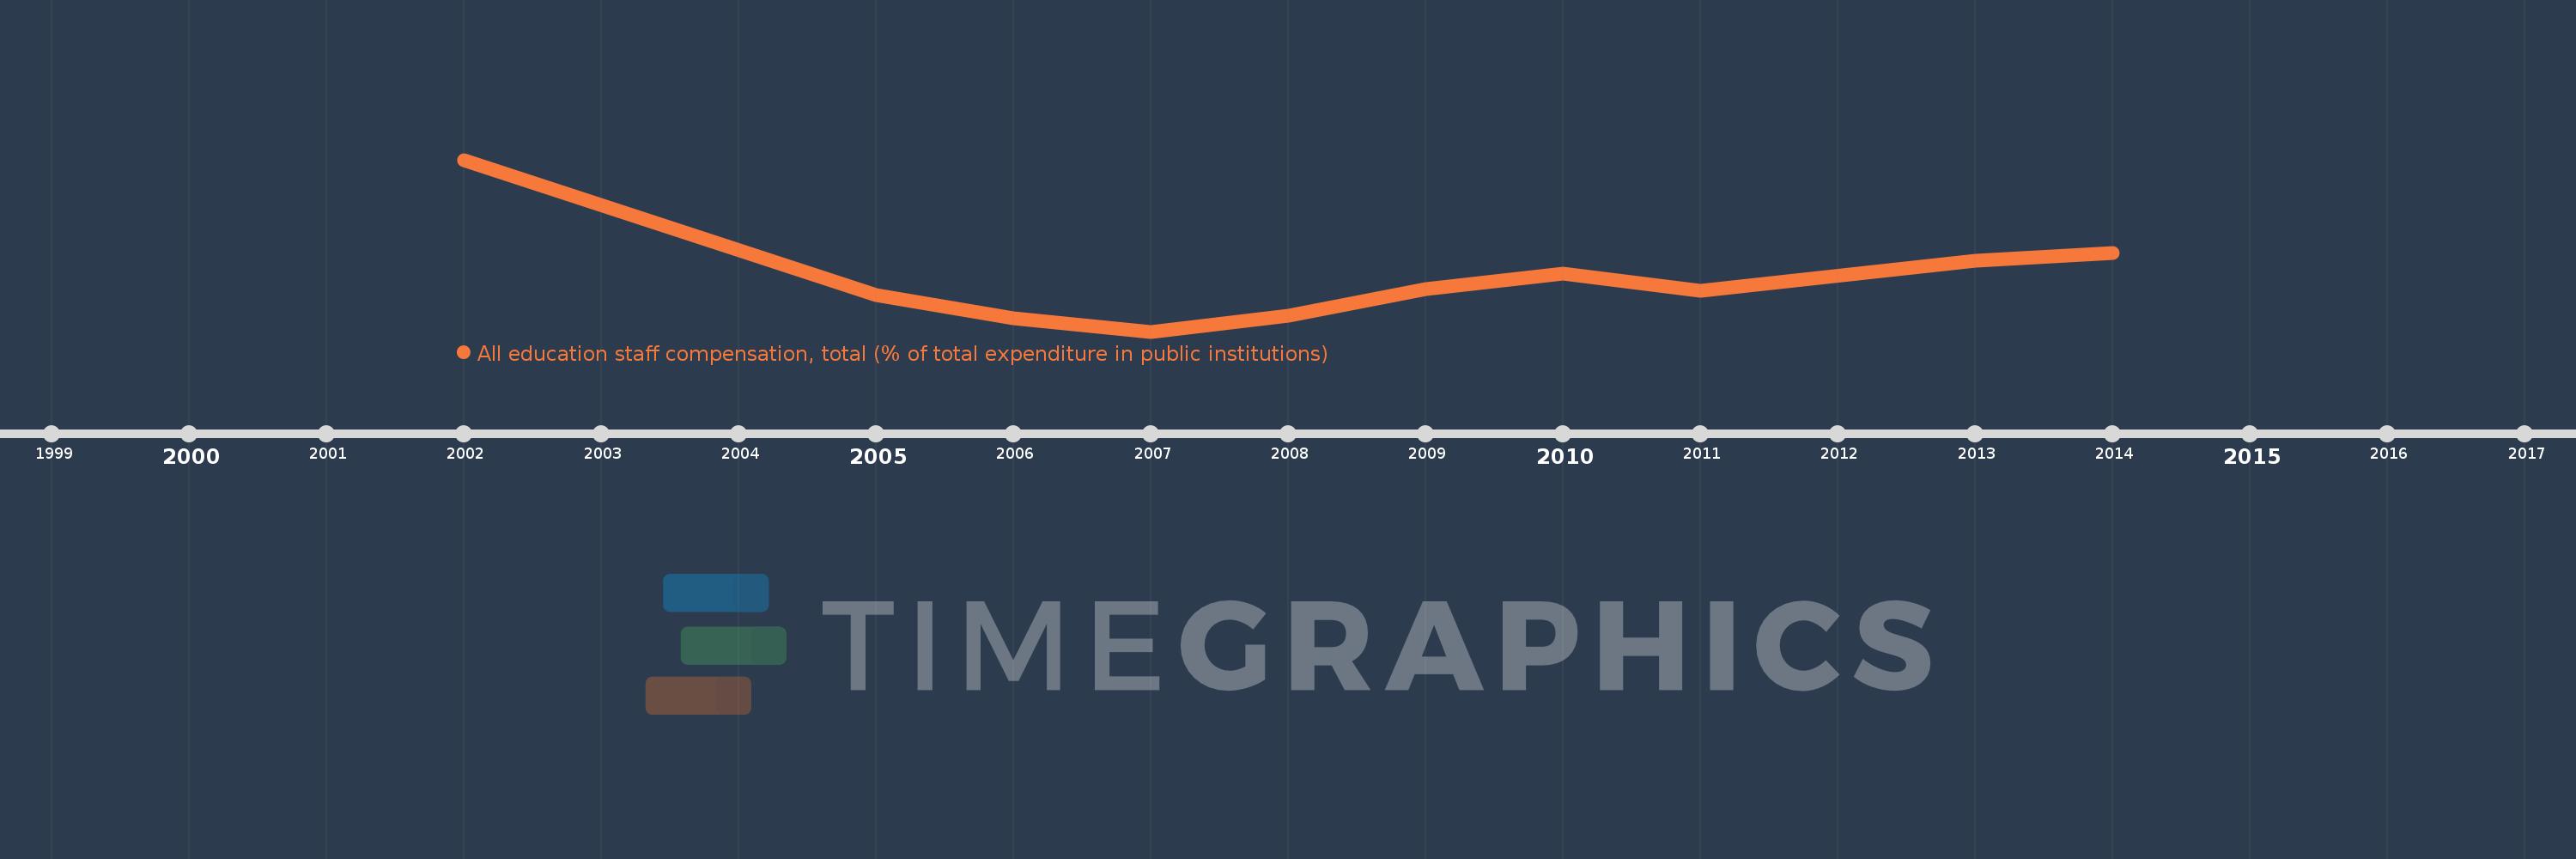
Questa scala temporale mostra un grafico dal 2002 anno al 2014 anno. Ghana. I dati fino ad 2001 anno non disponibili. Il numero di osservazioni attuali secondo i date: 10.
La fonte (nome):
Indicatori dello sviluppo mondiale
La fonte (organizzazione):
United Nations Educational, Scientific, and Cultural Organization (UNESCO) Institute for Statistics.
Categorie:
Education
sono stati aggiornati
23 apr 2017 anni
Indicatori delle variazioni dei valori per anni
In media:
71.391
Minima:
60.225
1 gen 2007 anni
Massimo:
96.59
1 gen 2002 anni
Alla data di osservazione
Valore
Variazione assoluta
La variazione rispetto al valore precedente
1 gen 2002 anni
96.59
+96.59
0.0%
1 gen 2005 anni
67.991
-28.599
-29.61%
1 gen 2006 anni
62.993
-4.999
-7.35%
1 gen 2007 anni
60.225
-2.767
-4.39%
1 gen 2008 anni
63.663
+3.437
5.71%
1 gen 2009 anni
69.215
+5.552
8.72%
1 gen 2010 anni
72.438
+3.223
4.66%
1 gen 2011 anni
68.819
-3.619
-5.0%
1 gen 2013 anni
75.146
+6.327
9.19%
1 gen 2014 anni
76.834
+1.687
2.25%
Classificazione dei paesi secondo i statistiche attuali per anni