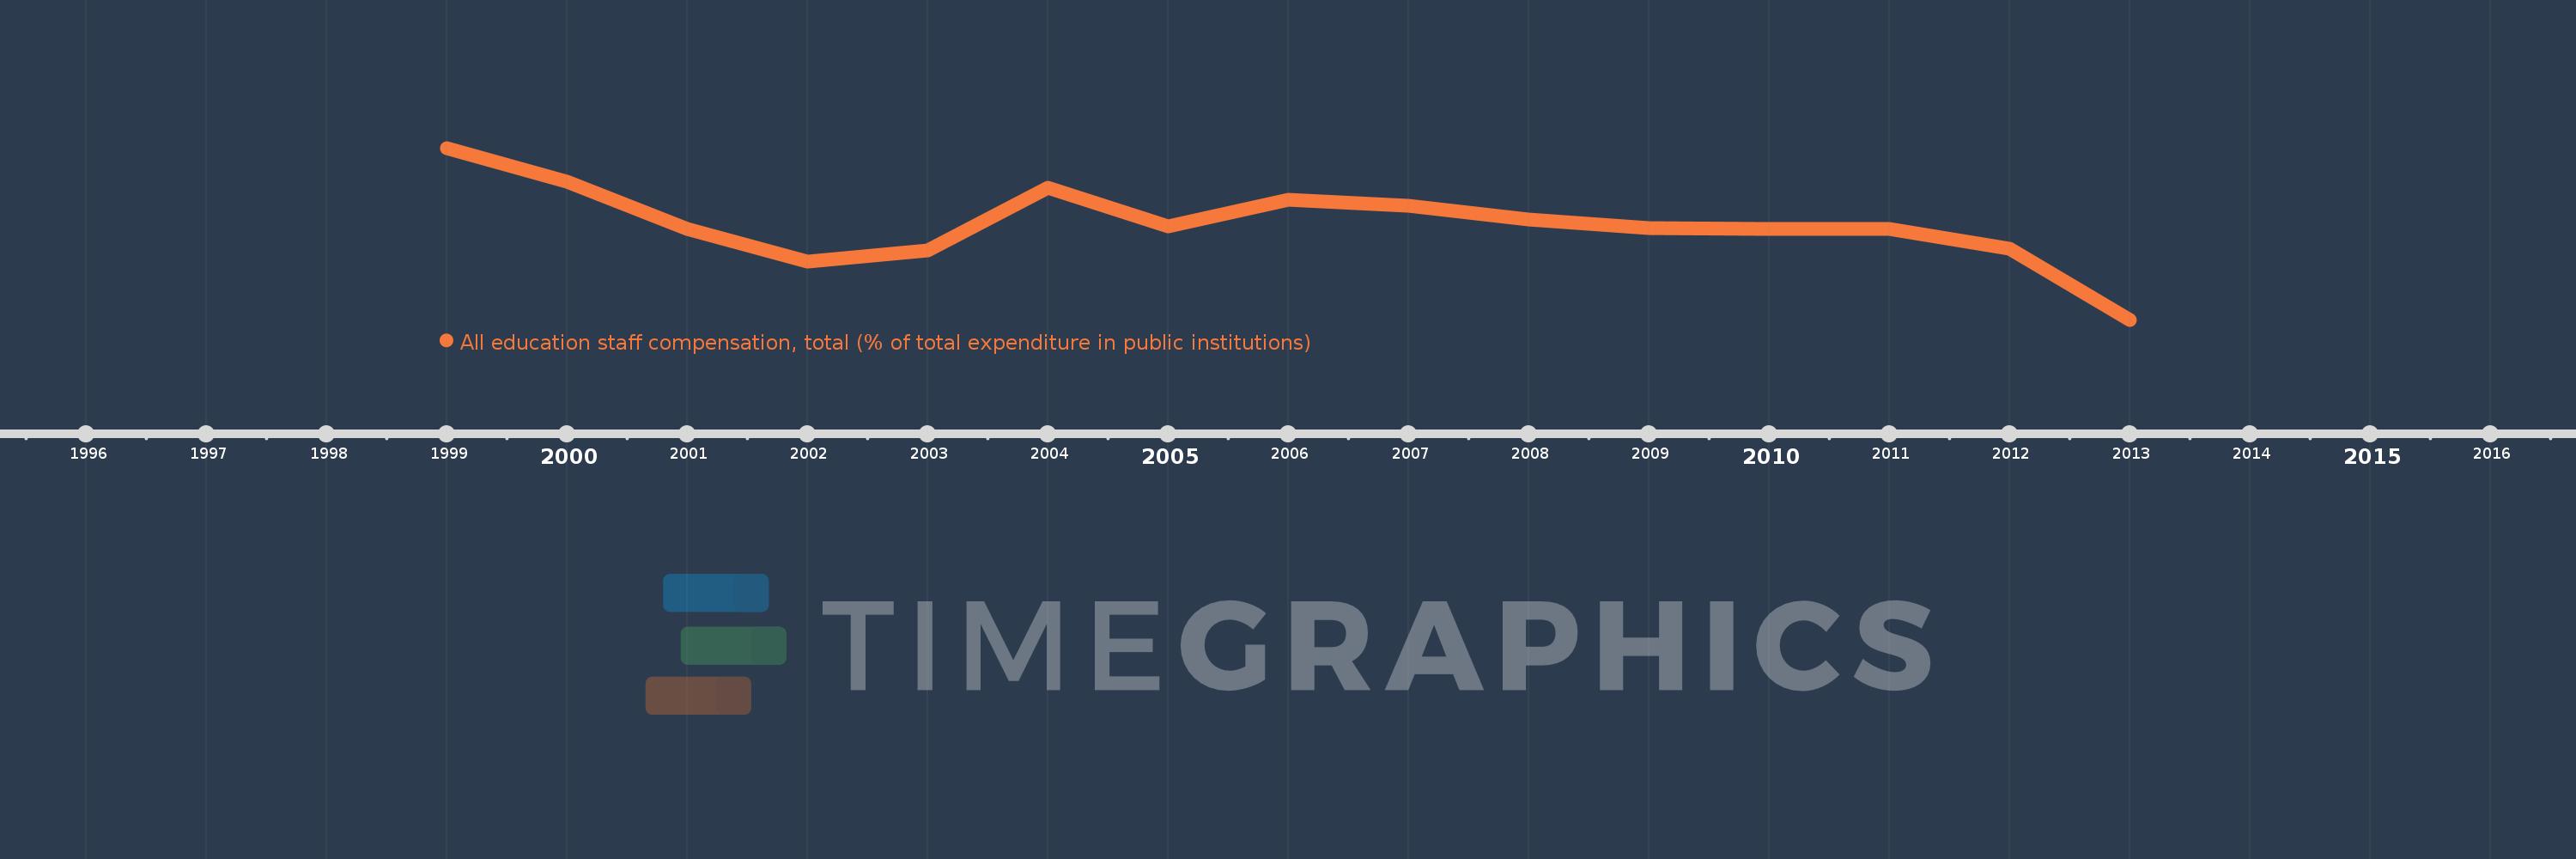
Questa scala temporale mostra un grafico dal 1999 anno al 2013 anno. Euro area. I dati fino ad 1998 anno non disponibili. Il numero di osservazioni attuali secondo i date: 15.
La fonte (nome):
Indicatori dello sviluppo mondiale
La fonte (organizzazione):
United Nations Educational, Scientific, and Cultural Organization (UNESCO) Institute for Statistics.
Categorie:
Education
sono stati aggiornati
23 apr 2017 anni
Indicatori delle variazioni dei valori per anni
In media:
71.72
Minima:
68.496
1 gen 2013 anni
Massimo:
74.3
1 gen 1999 anni
Alla data di osservazione
Valore
Variazione assoluta
La variazione rispetto al valore precedente
1 gen 1999 anni
74.3
+74.3
0.0%
1 gen 2000 anni
73.153
-1.147
-1.54%
1 gen 2001 anni
71.577
-1.576
-2.15%
1 gen 2002 anni
70.452
-1.125
-1.57%
1 gen 2003 anni
70.85
+0.398
0.57%
1 gen 2004 anni
72.942
+2.092
2.95%
1 gen 2005 anni
71.661
-1.281
-1.76%
1 gen 2006 anni
72.55
+0.889
1.24%
1 gen 2007 anni
72.335
-0.215
-0.3%
1 gen 2008 anni
71.877
-0.458
-0.63%
1 gen 2009 anni
71.58
-0.297
-0.41%
1 gen 2010 anni
71.57
-0.011
-0.02%
1 gen 2011 anni
71.563
-0.007
-0.01%
1 gen 2012 anni
70.893
-0.67
-0.94%
1 gen 2013 anni
68.496
-2.397
-3.38%
Classificazione dei paesi secondo i statistiche attuali per anni