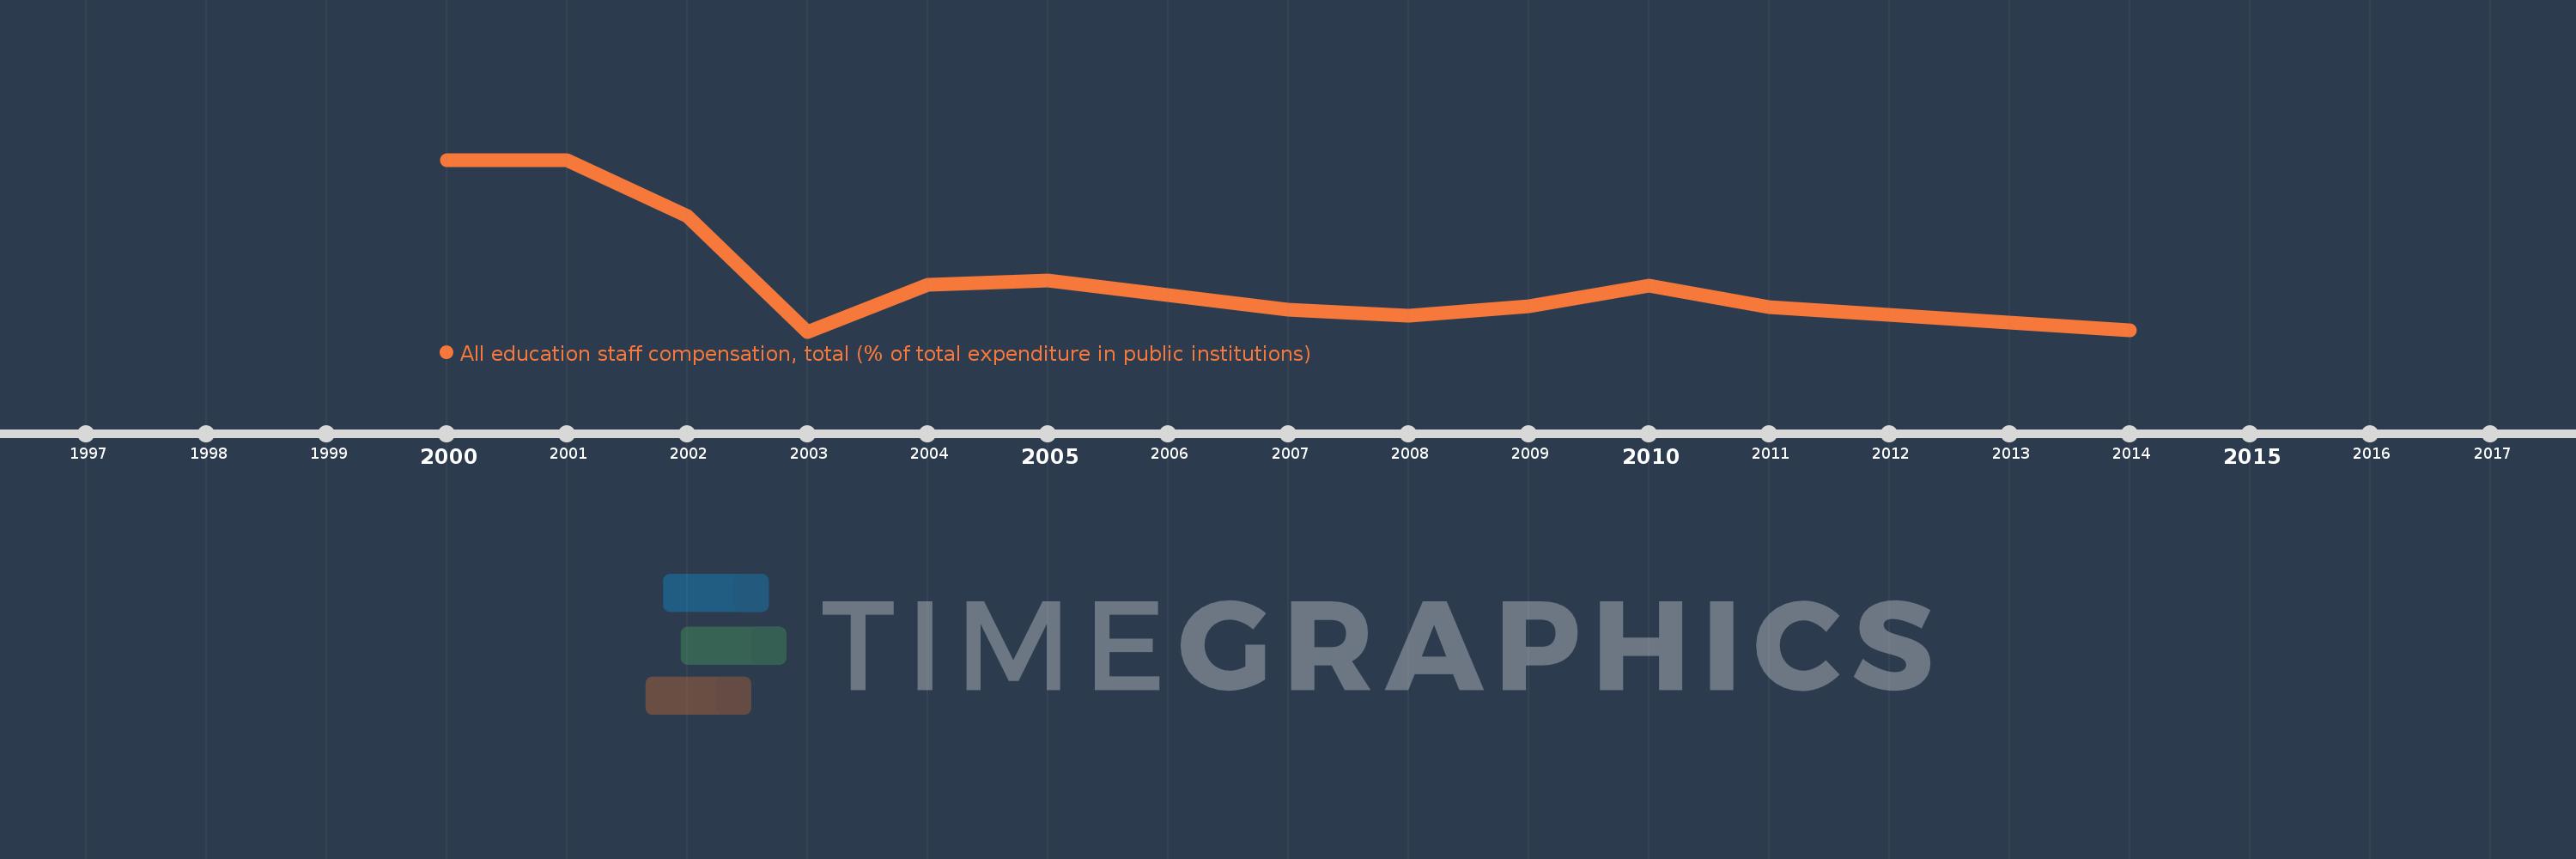
Questa scala temporale mostra un grafico dal 2000 anno al 2014 anno. Latvia. I dati fino ad 1999 anno non disponibili. Il numero di osservazioni attuali secondo i date: 13.
La fonte (nome):
Indicatori dello sviluppo mondiale
La fonte (organizzazione):
United Nations Educational, Scientific, and Cultural Organization (UNESCO) Institute for Statistics.
Categorie:
Education
sono stati aggiornati
23 apr 2017 anni
Indicatori delle variazioni dei valori per anni
In media:
70.211
Minima:
62.044
1 gen 2003 anni
Massimo:
87.783
1 gen 2001 anni
Alla data di osservazione
Valore
Variazione assoluta
La variazione rispetto al valore precedente
1 gen 2000 anni
87.754
+87.754
0.0%
1 gen 2001 anni
87.783
+0.029
0.03%
1 gen 2002 anni
79.366
-8.418
-9.59%
1 gen 2003 anni
62.044
-17.322
-21.83%
1 gen 2004 anni
69.009
+6.965
11.23%
1 gen 2005 anni
69.672
+0.663
0.96%
1 gen 2007 anni
65.371
-4.3
-6.17%
1 gen 2008 anni
64.403
-0.968
-1.48%
1 gen 2009 anni
65.875
+1.472
2.29%
1 gen 2010 anni
68.983
+3.108
4.72%
1 gen 2011 anni
65.72
-3.262
-4.73%
1 gen 2012 anni
64.492
-1.229
-1.87%
1 gen 2014 anni
62.266
-2.226
-3.45%
Classificazione dei paesi secondo i statistiche attuali per anni