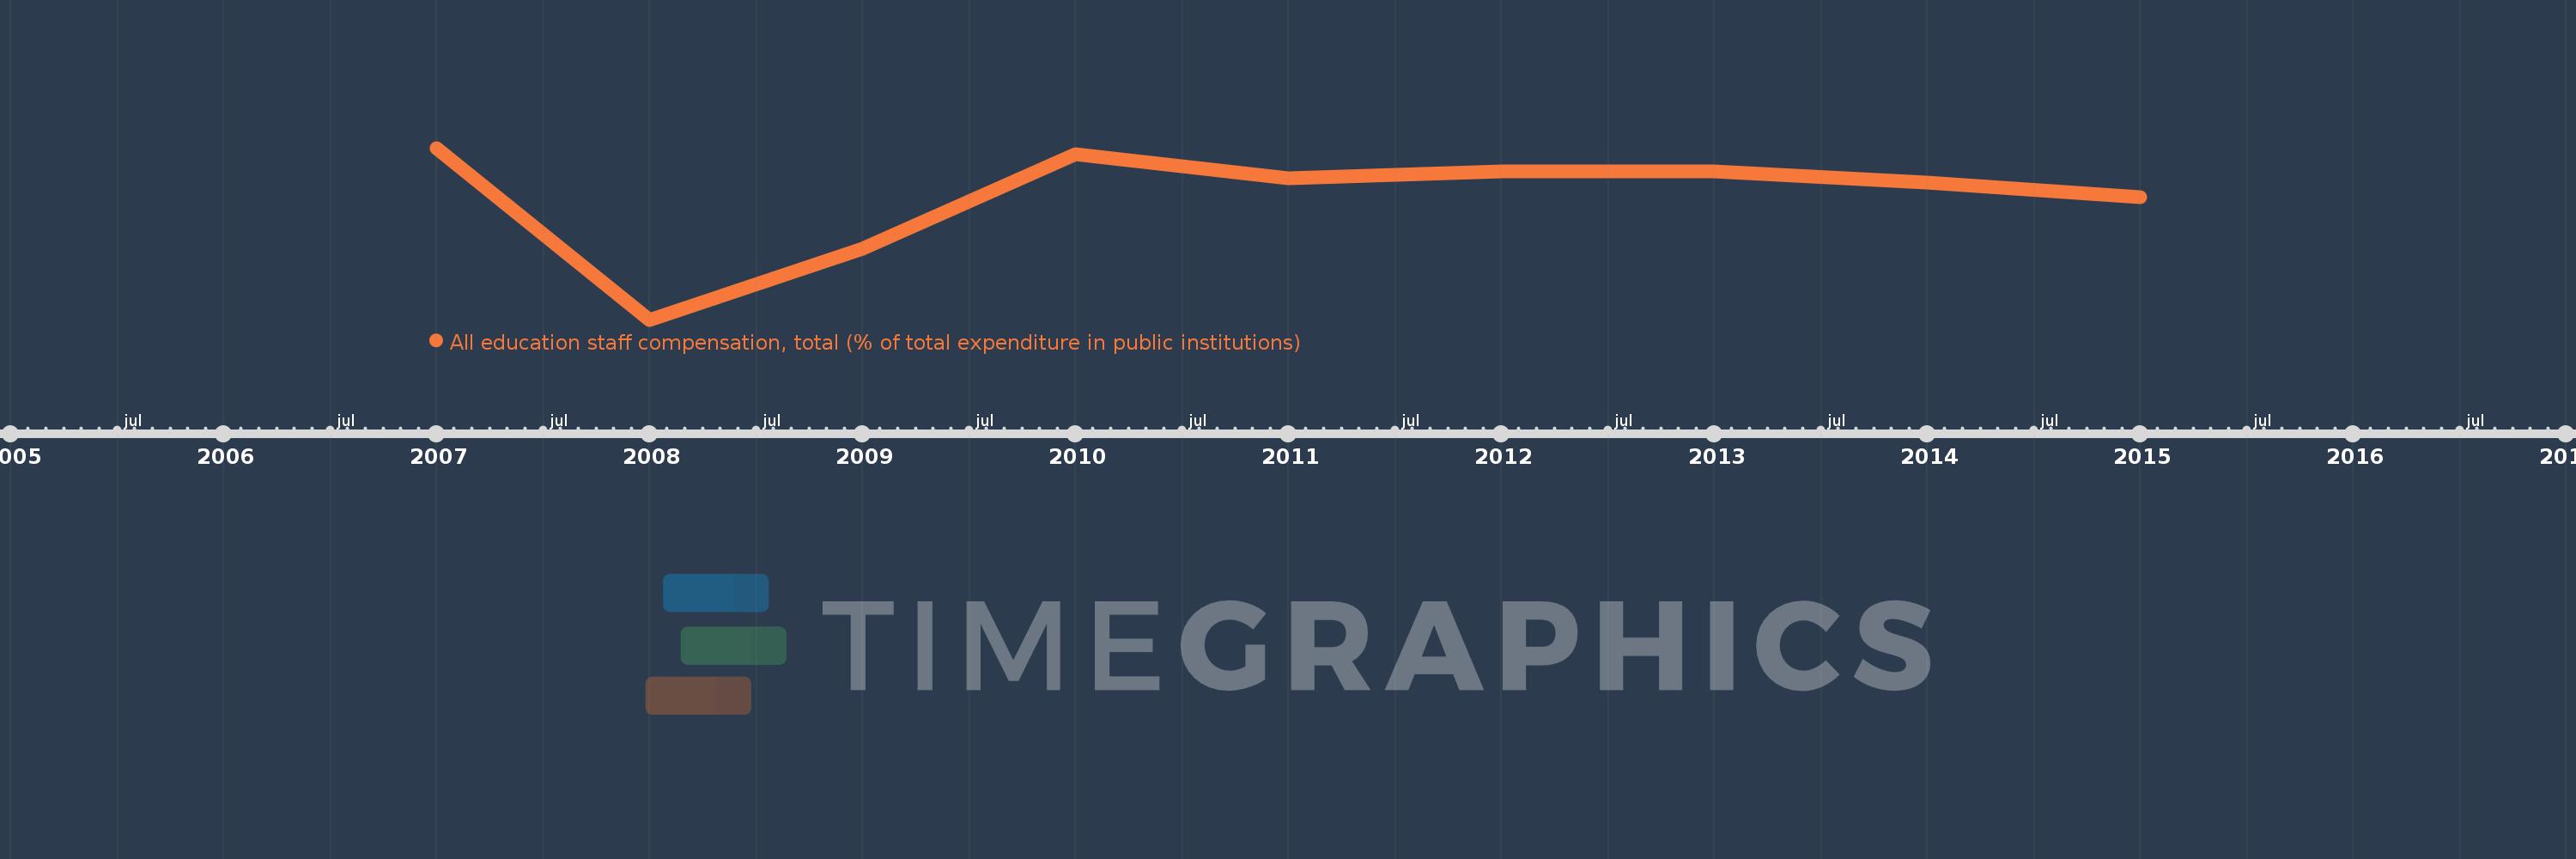
Questa scala temporale mostra un grafico dal 2007 anno al 2015 anno. Moldova. I dati fino ad 2006 anno non disponibili. Il numero di osservazioni attuali secondo i date: 9.
La fonte (nome):
Indicatori dello sviluppo mondiale
La fonte (organizzazione):
United Nations Educational, Scientific, and Cultural Organization (UNESCO) Institute for Statistics.
Categorie:
Education
sono stati aggiornati
23 apr 2017 anni
Indicatori delle variazioni dei valori per anni
In media:
60.782
Minima:
48.542
1 gen 2008 anni
Massimo:
65.651
1 gen 2007 anni
Alla data di osservazione
Valore
Variazione assoluta
La variazione rispetto al valore precedente
1 gen 2007 anni
65.651
+65.651
0.0%
1 gen 2008 anni
48.542
-17.109
-26.06%
1 gen 2009 anni
55.609
+7.067
14.56%
1 gen 2010 anni
65.021
+9.412
16.93%
1 gen 2011 anni
62.647
-2.374
-3.65%
1 gen 2012 anni
63.311
+0.664
1.06%
1 gen 2013 anni
63.28
-0.031
-0.05%
1 gen 2014 anni
62.197
-1.083
-1.71%
1 gen 2015 anni
60.777
-1.421
-2.28%
Classificazione dei paesi secondo i statistiche attuali per anni