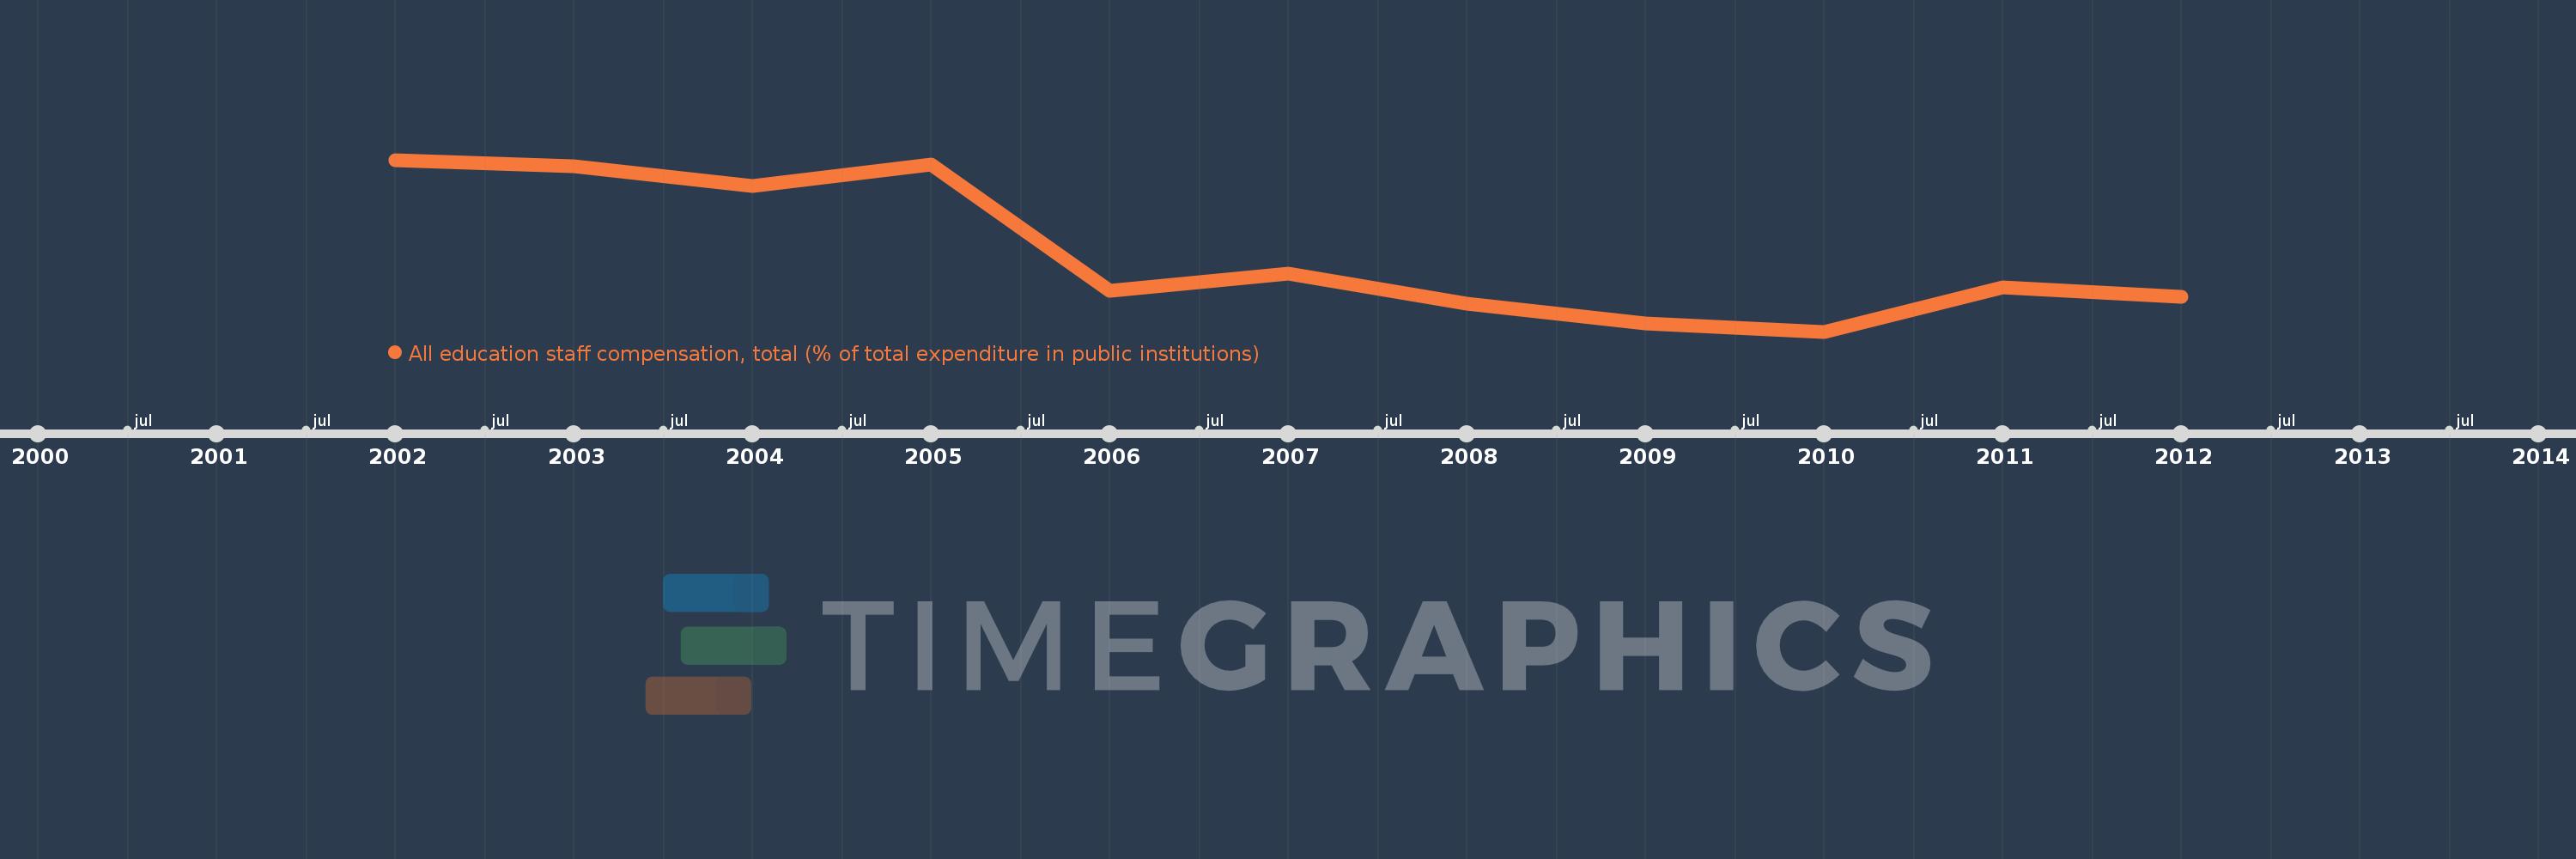
Questa scala temporale mostra un grafico dal 2002 anno al 2012 anno. Mexico. I dati fino ad 2001 anno non disponibili. Il numero di osservazioni attuali secondo i date: 11.
La fonte (nome):
Indicatori dello sviluppo mondiale
La fonte (organizzazione):
United Nations Educational, Scientific, and Cultural Organization (UNESCO) Institute for Statistics.
Categorie:
Education
sono stati aggiornati
23 apr 2017 anni
Indicatori delle variazioni dei valori per anni
In media:
86.48
Minima:
84.777
1 gen 2010 anni
Massimo:
88.504
1 gen 2002 anni
Alla data di osservazione
Valore
Variazione assoluta
La variazione rispetto al valore precedente
1 gen 2002 anni
88.504
+88.504
0.0%
1 gen 2003 anni
88.358
-0.147
-0.17%
1 gen 2004 anni
87.943
-0.415
-0.47%
1 gen 2005 anni
88.403
+0.46
0.52%
1 gen 2006 anni
85.671
-2.732
-3.09%
1 gen 2007 anni
86.026
+0.355
0.41%
1 gen 2008 anni
85.379
-0.648
-0.75%
1 gen 2009 anni
84.955
-0.424
-0.5%
1 gen 2010 anni
84.777
-0.178
-0.21%
1 gen 2011 anni
85.738
+0.962
1.13%
1 gen 2012 anni
85.524
-0.214
-0.25%
Classificazione dei paesi secondo i statistiche attuali per anni