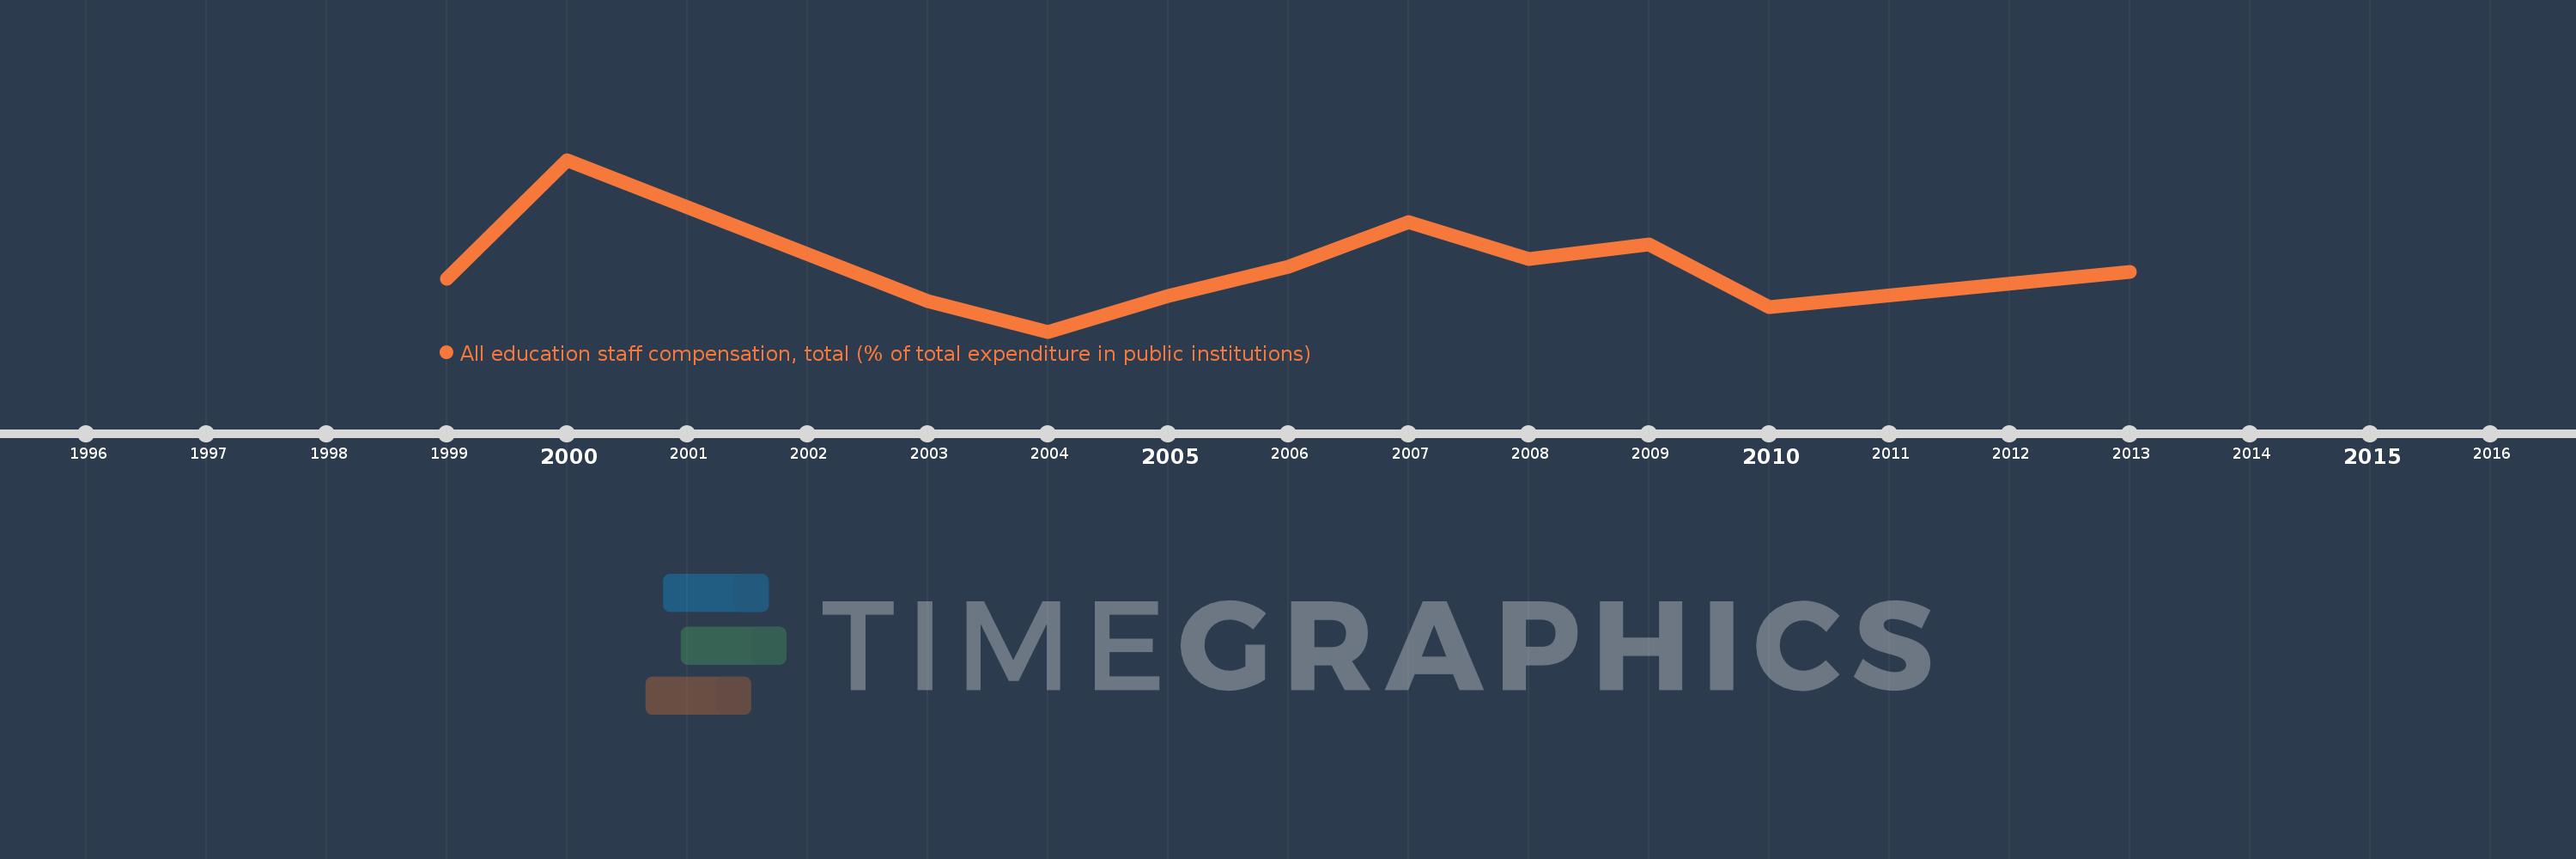
Questa scala temporale mostra un grafico dal 1999 anno al 2013 anno. Korea, Rep.. I dati fino ad 1998 anno non disponibili. Il numero di osservazioni attuali secondo i date: 11.
La fonte (nome):
Indicatori dello sviluppo mondiale
La fonte (organizzazione):
United Nations Educational, Scientific, and Cultural Organization (UNESCO) Institute for Statistics.
Categorie:
Education
sono stati aggiornati
23 apr 2017 anni
Indicatori delle variazioni dei valori per anni
In media:
58.658
Minima:
54.023
1 gen 2004 anni
Massimo:
66.388
1 gen 2000 anni
Alla data di osservazione
Valore
Variazione assoluta
La variazione rispetto al valore precedente
1 gen 1999 anni
57.832
+57.832
0.0%
1 gen 2000 anni
66.388
+8.556
14.8%
1 gen 2003 anni
56.219
-10.169
-15.32%
1 gen 2004 anni
54.023
-2.196
-3.91%
1 gen 2005 anni
56.602
+2.579
4.77%
1 gen 2006 anni
58.662
+2.06
3.64%
1 gen 2007 anni
61.899
+3.237
5.52%
1 gen 2008 anni
59.246
-2.654
-4.29%
1 gen 2009 anni
60.307
+1.062
1.79%
1 gen 2010 anni
55.759
-4.549
-7.54%
1 gen 2013 anni
58.295
+2.536
4.55%
Classificazione dei paesi secondo i statistiche attuali per anni