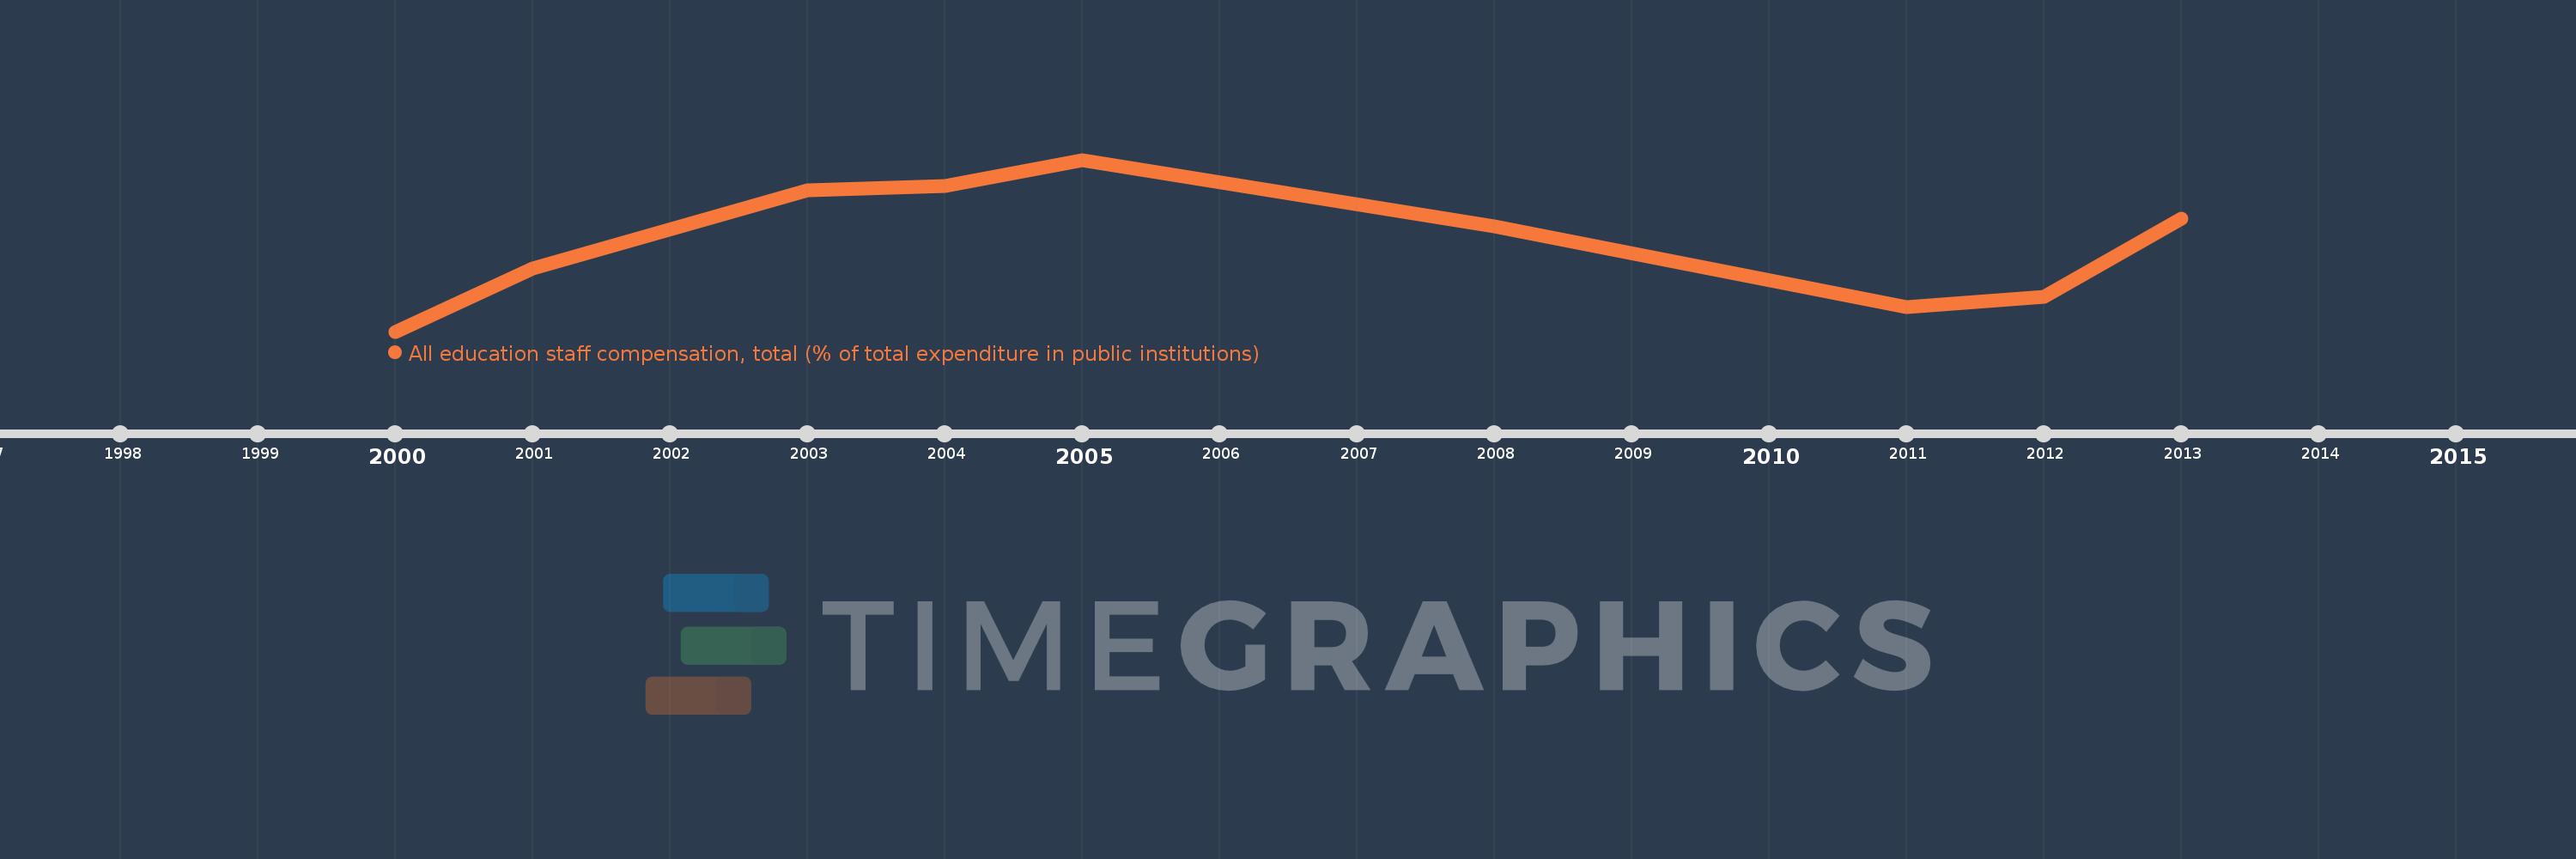
Questa scala temporale mostra un grafico dal 2000 anno al 2013 anno. Paraguay. I dati fino ad 1999 anno non disponibili. Il numero di osservazioni attuali secondo i date: 9.
La fonte (nome):
Indicatori dello sviluppo mondiale
La fonte (organizzazione):
United Nations Educational, Scientific, and Cultural Organization (UNESCO) Institute for Statistics.
Categorie:
Education
sono stati aggiornati
23 apr 2017 anni
Indicatori delle variazioni dei valori per anni
In media:
75.95
Minima:
61.517
1 gen 2000 anni
Massimo:
89.414
1 gen 2005 anni
Alla data di osservazione
Valore
Variazione assoluta
La variazione rispetto al valore precedente
1 gen 2000 anni
61.517
+61.517
0.0%
1 gen 2001 anni
71.821
+10.304
16.75%
1 gen 2003 anni
84.488
+12.667
17.64%
1 gen 2004 anni
85.118
+0.63
0.75%
1 gen 2005 anni
89.414
+4.296
5.05%
1 gen 2008 anni
78.651
-10.763
-12.04%
1 gen 2011 anni
65.527
-13.124
-16.69%
1 gen 2012 anni
67.129
+1.602
2.44%
1 gen 2013 anni
79.882
+12.754
19.0%
Classificazione dei paesi secondo i statistiche attuali per anni