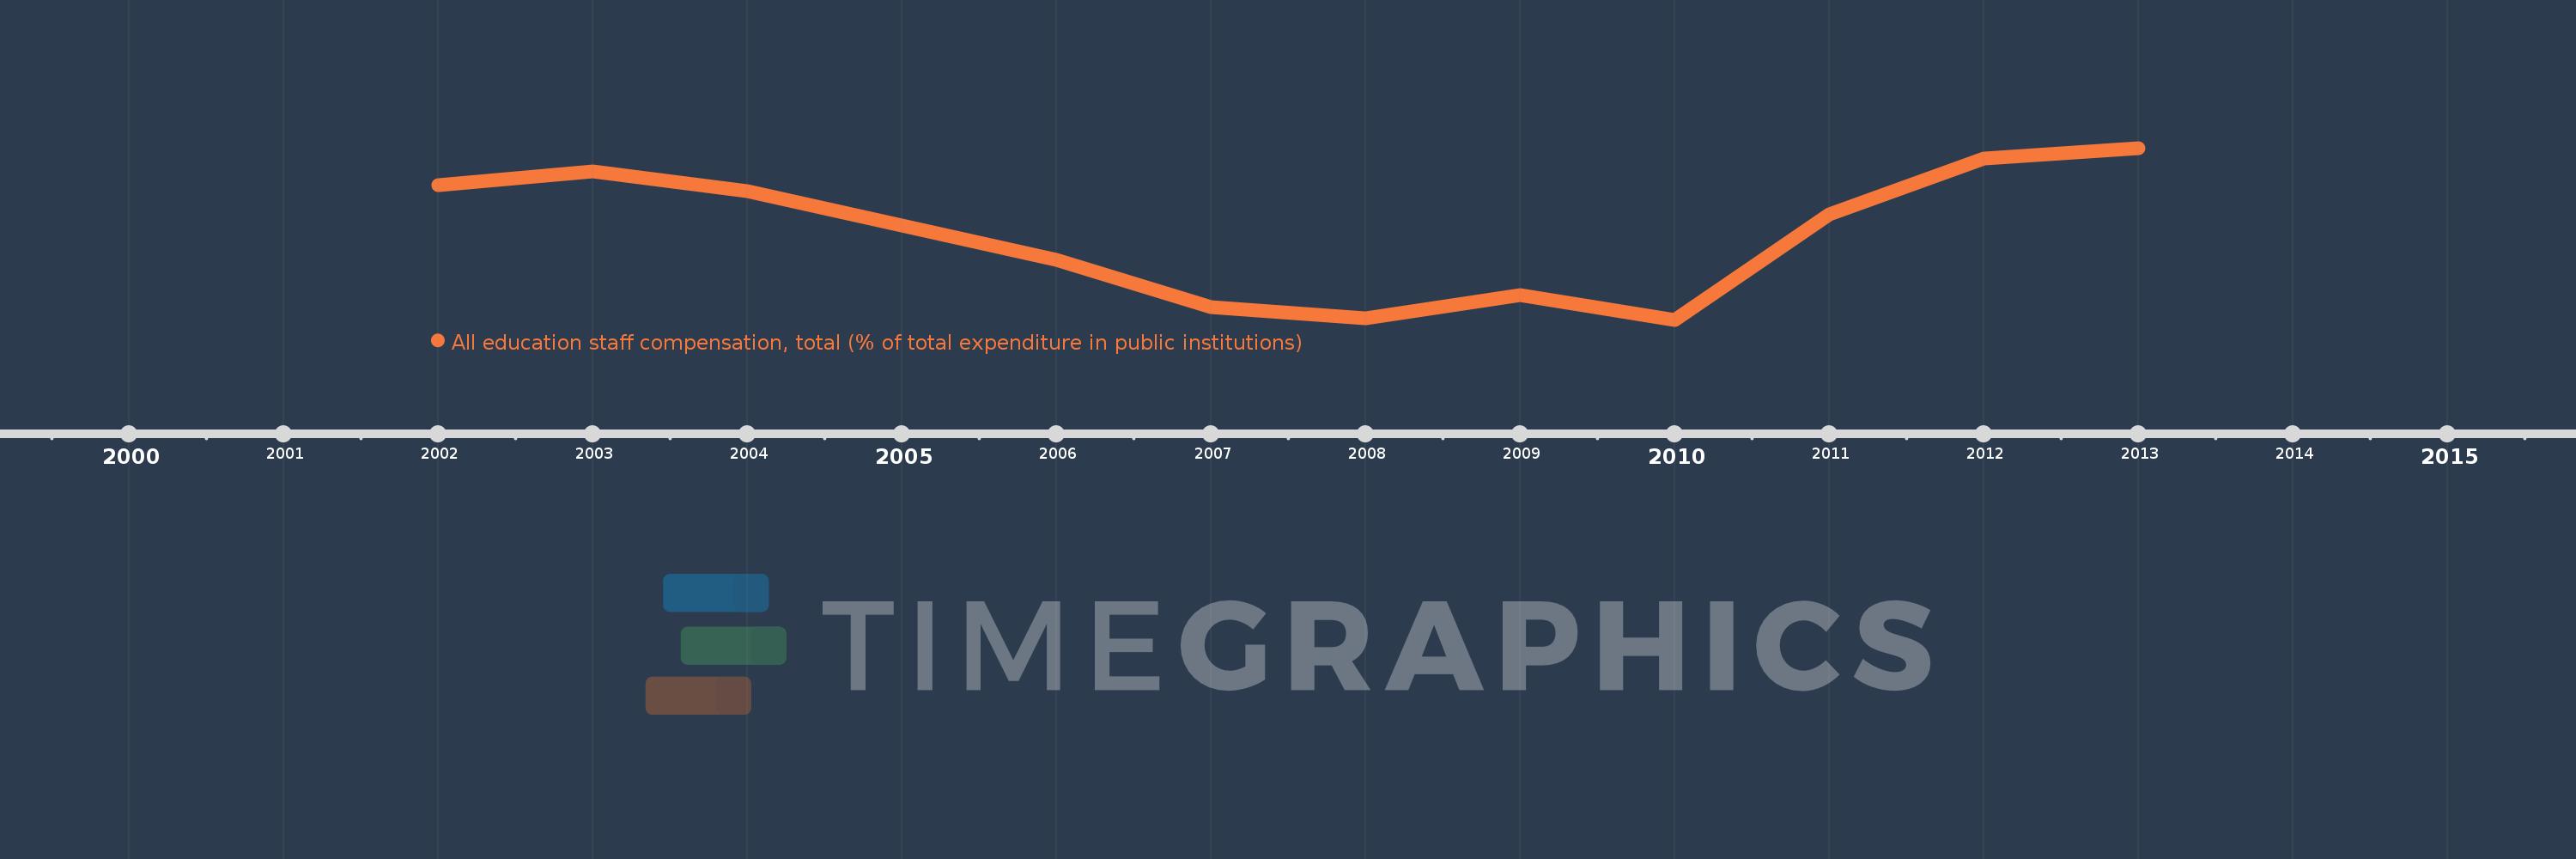
Questa scala temporale mostra un grafico dal 2002 anno al 2013 anno. Bulgaria. I dati fino ad 2001 anno non disponibili. Il numero di osservazioni attuali secondo i date: 11.
La fonte (nome):
Indicatori dello sviluppo mondiale
La fonte (organizzazione):
United Nations Educational, Scientific, and Cultural Organization (UNESCO) Institute for Statistics.
Categorie:
Education
sono stati aggiornati
23 apr 2017 anni
Indicatori delle variazioni dei valori per anni
In media:
65.12
Minima:
58.734
1 gen 2010 anni
Massimo:
71.45
1 gen 2013 anni
Alla data di osservazione
Valore
Variazione assoluta
La variazione rispetto al valore precedente
1 gen 2002 anni
68.68
+68.68
0.0%
1 gen 2003 anni
69.685
+1.004
1.46%
1 gen 2004 anni
68.232
-1.453
-2.08%
1 gen 2006 anni
63.196
-5.036
-7.38%
1 gen 2007 anni
59.659
-3.537
-5.6%
1 gen 2008 anni
58.87
-0.789
-1.32%
1 gen 2009 anni
60.571
+1.701
2.89%
1 gen 2010 anni
58.734
-1.837
-3.03%
1 gen 2011 anni
66.556
+7.822
13.32%
1 gen 2012 anni
70.686
+4.13
6.21%
1 gen 2013 anni
71.45
+0.764
1.08%
Classificazione dei paesi secondo i statistiche attuali per anni