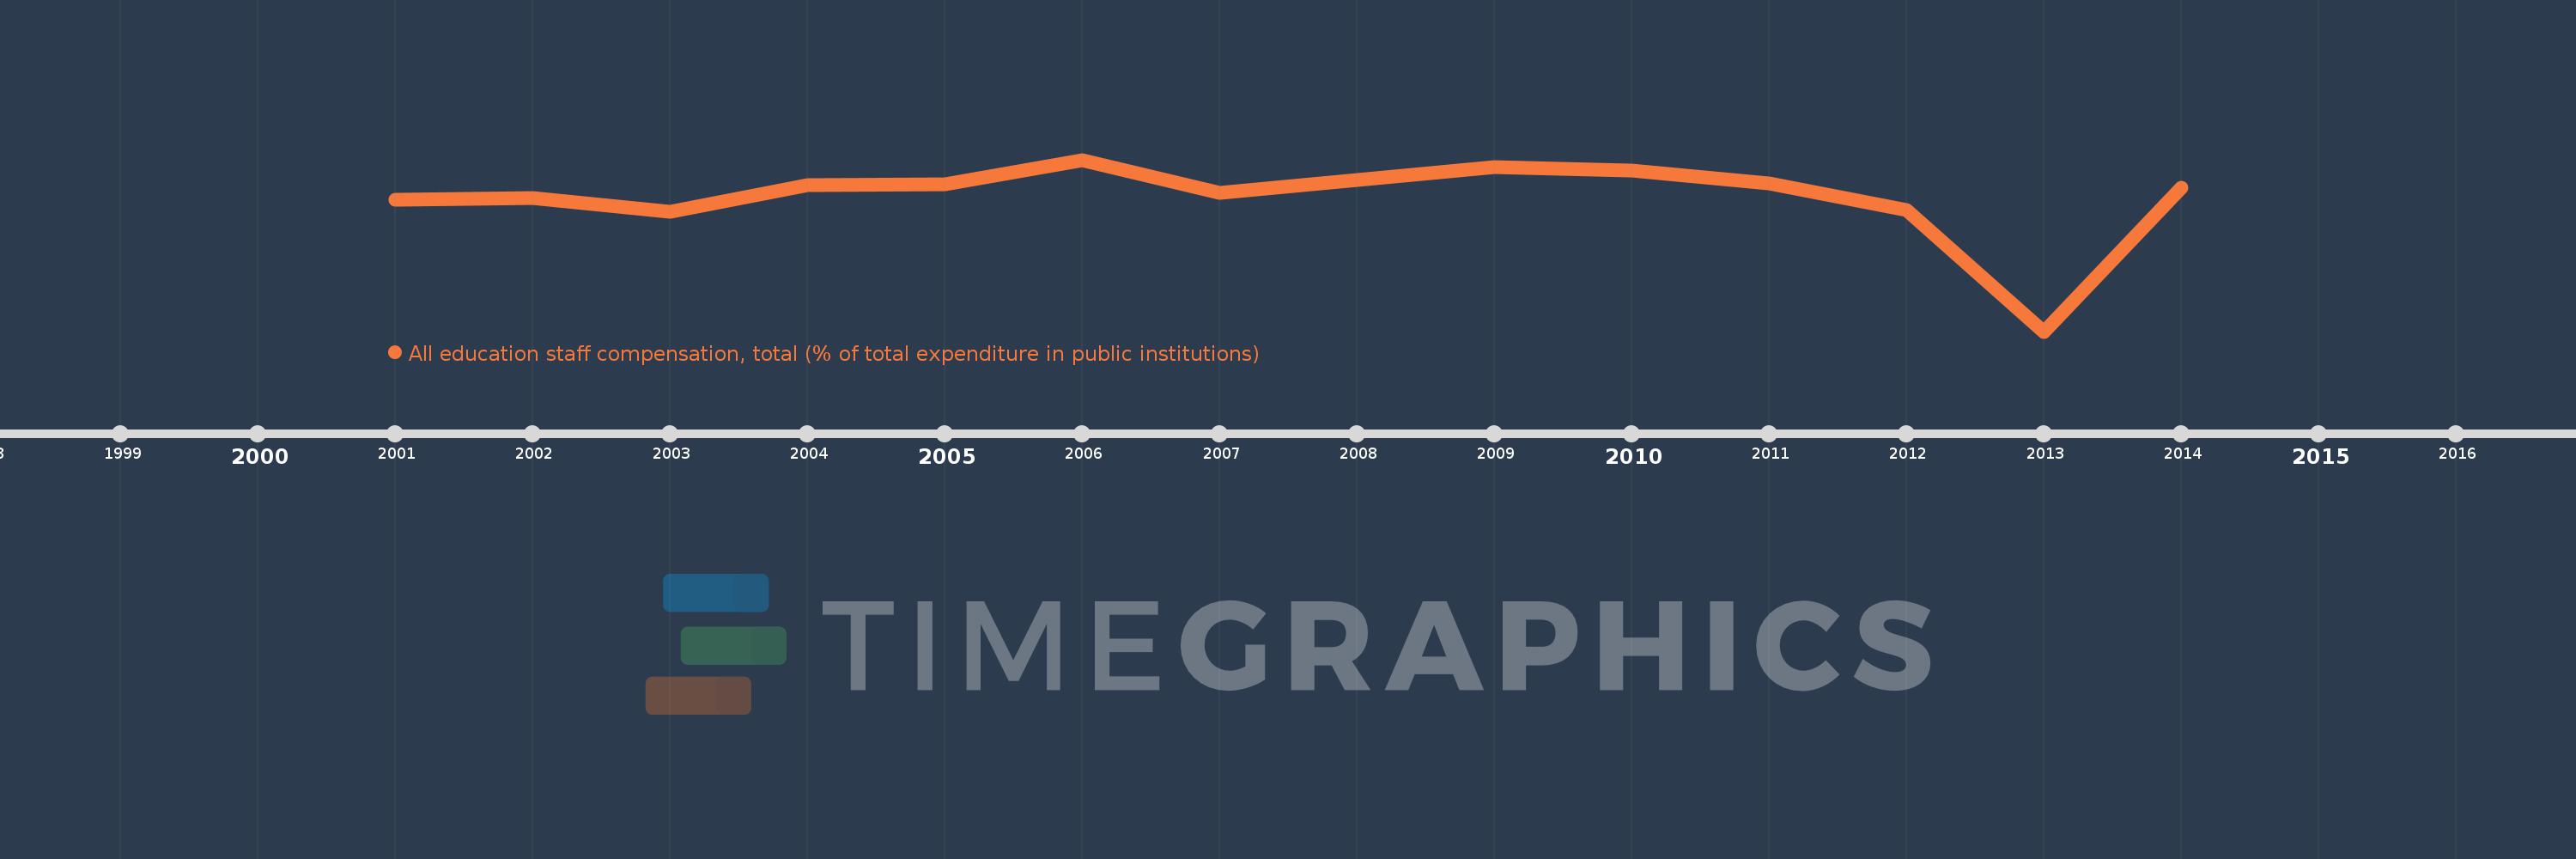
Questa scala temporale mostra un grafico dal 2001 anno al 2014 anno. Azerbaijan. I dati fino ad 2000 anno non disponibili. Il numero di osservazioni attuali secondo i date: 14.
La fonte (nome):
Indicatori dello sviluppo mondiale
La fonte (organizzazione):
United Nations Educational, Scientific, and Cultural Organization (UNESCO) Institute for Statistics.
Categorie:
Education
sono stati aggiornati
23 apr 2017 anni
Indicatori delle variazioni dei valori per anni
In media:
63.745
Minima:
52.845
1 gen 2013 anni
Massimo:
66.791
1 gen 2006 anni
Alla data di osservazione
Valore
Variazione assoluta
La variazione rispetto al valore precedente
1 gen 2001 anni
63.581
+63.581
0.0%
1 gen 2002 anni
63.656
+0.075
0.12%
1 gen 2003 anni
62.592
-1.064
-1.67%
1 gen 2004 anni
64.709
+2.117
3.38%
1 gen 2005 anni
64.825
+0.116
0.18%
1 gen 2006 anni
66.791
+1.966
3.03%
1 gen 2007 anni
64.126
-2.665
-3.99%
1 gen 2008 anni
65.139
+1.013
1.58%
1 gen 2009 anni
66.211
+1.072
1.65%
1 gen 2010 anni
65.904
-0.308
-0.46%
1 gen 2011 anni
64.847
-1.056
-1.6%
1 gen 2012 anni
62.68
-2.167
-3.34%
1 gen 2013 anni
52.845
-9.834
-15.69%
1 gen 2014 anni
64.52
+11.674
22.09%
Classificazione dei paesi secondo i statistiche attuali per anni