Questa scala temporale mostra un grafico dal 1999 anno al 2010 anno. Philippines. I dati fino ad 1998 anno non disponibili. Il numero di osservazioni attuali secondo i date: 10.
La fonte (nome):
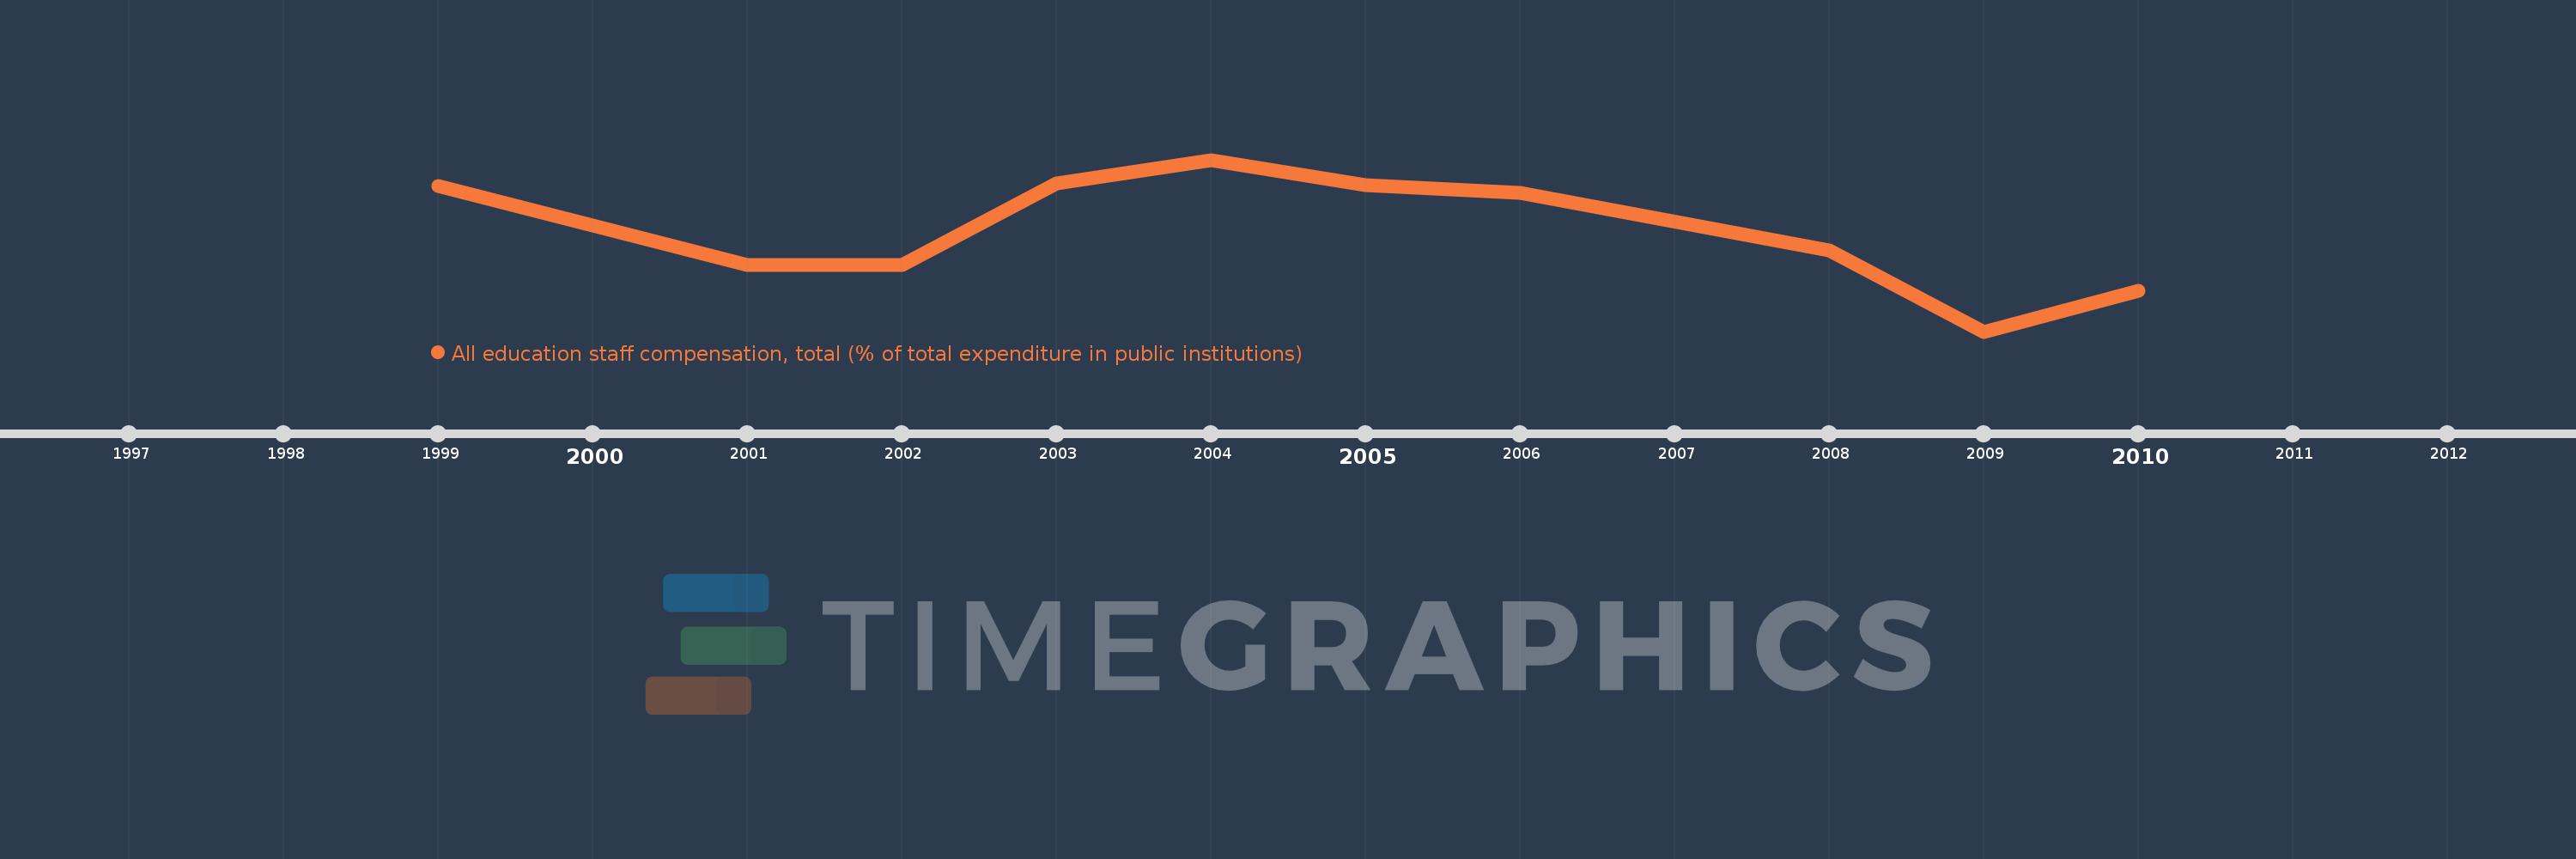
Indicatori dello sviluppo mondiale
La fonte (organizzazione):
United Nations Educational, Scientific, and Cultural Organization (UNESCO) Institute for Statistics.
Categorie:
Education
sono stati aggiornati
23 apr 2017 anni
Indicatori delle variazioni dei valori per anni
In media:
80.773
Minima:
68.327
1 gen 2009 anni
Massimo:
89.593
1 gen 2004 anni
Alla data di osservazione
Valore
Variazione assoluta
La variazione rispetto al valore precedente
1 gen 1999 anni
86.339
+86.339
0.0%
1 gen 2001 anni
76.569
-9.77
-11.32%
1 gen 2002 anni
76.569
0.0
0.0%
1 gen 2003 anni
86.628
+10.059
13.14%
1 gen 2004 anni
89.593
+2.964
3.42%
1 gen 2005 anni
86.441
-3.152
-3.52%
1 gen 2006 anni
85.486
-0.955
-1.11%
1 gen 2008 anni
78.411
-7.075
-8.28%
1 gen 2009 anni
68.327
-10.083
-12.86%
1 gen 2010 anni
73.366
+5.039
7.37%
Classificazione dei paesi secondo i statistiche attuali per anni