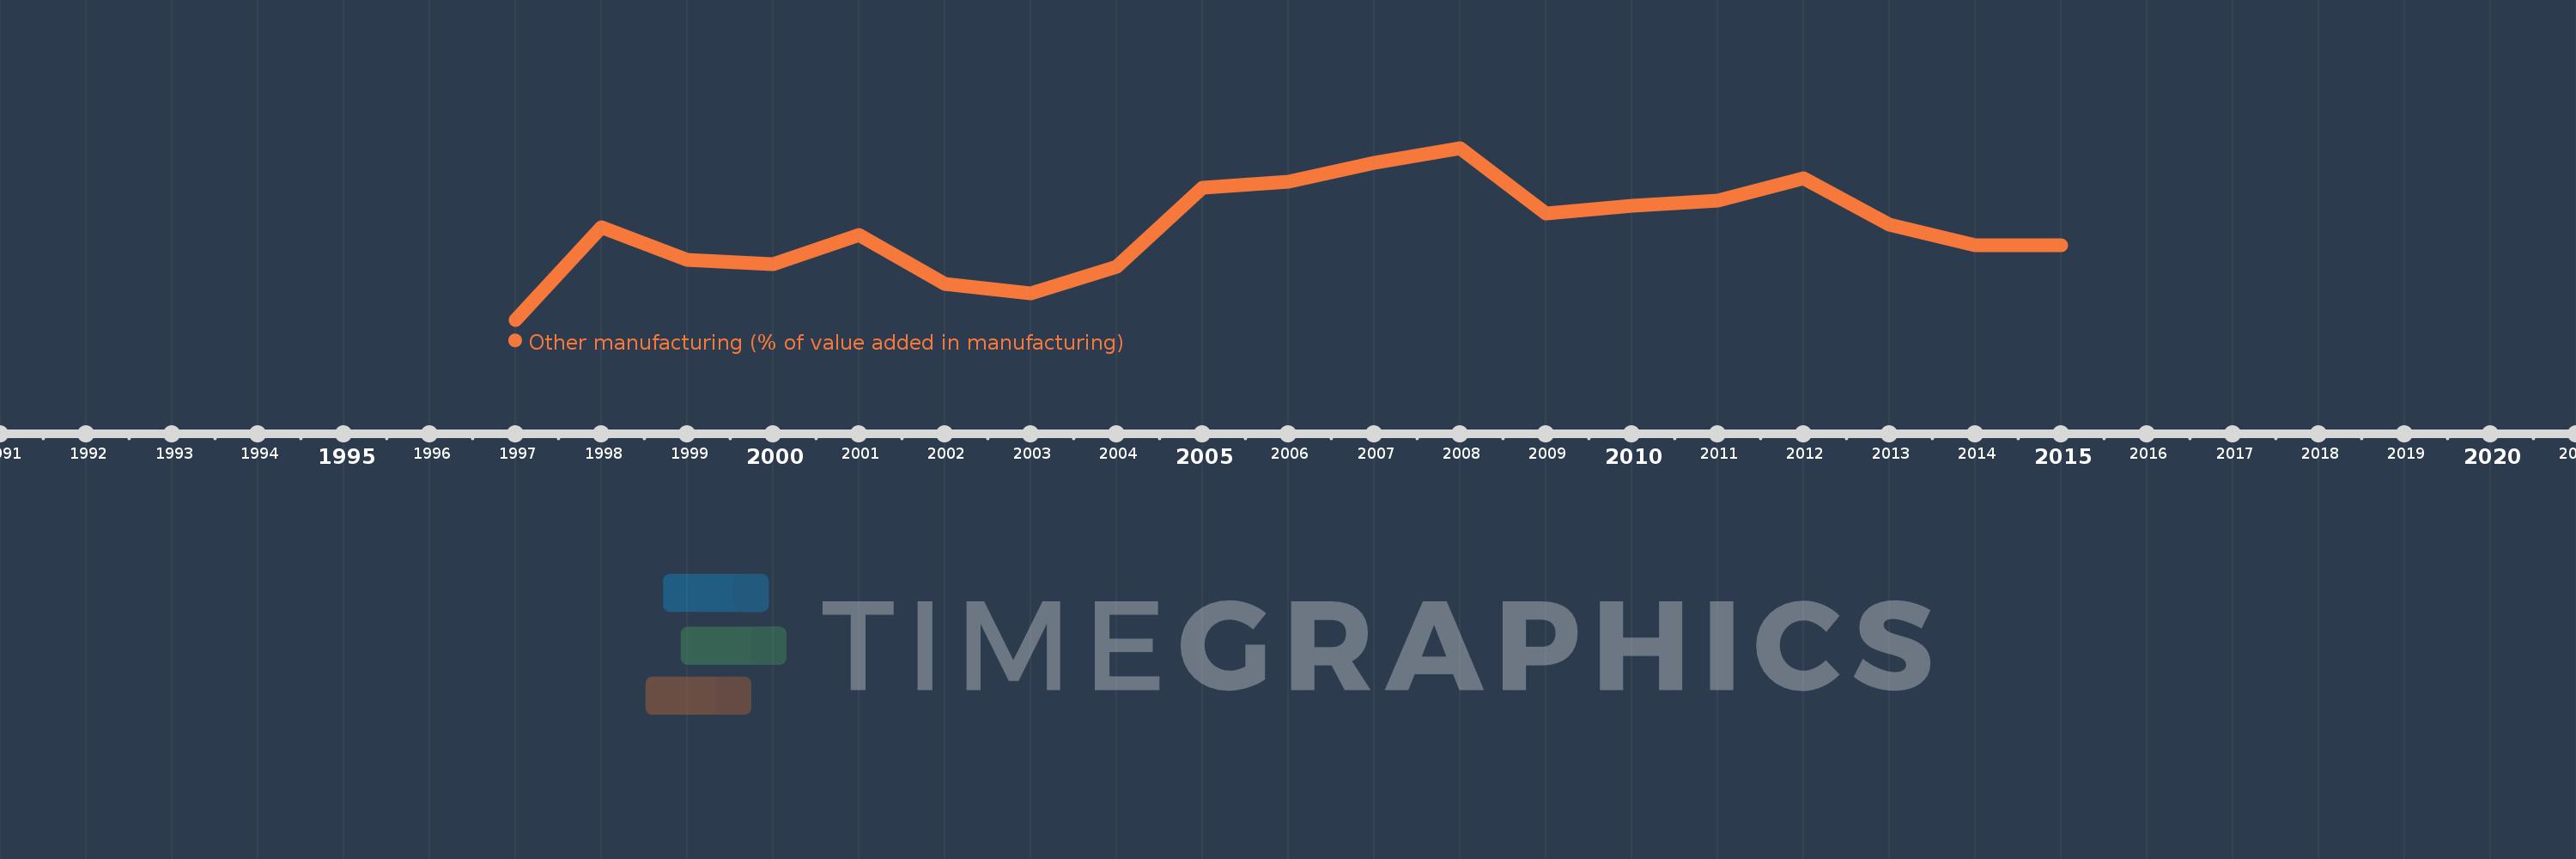
Questa scala temporale mostra un grafico dal 1997 anno al 2015 anno. Bulgaria. I dati fino ad 1996 anno non disponibili. Il numero di osservazioni attuali secondo i date: 19.
La fonte (nome):
Indicatori dello sviluppo mondiale
La fonte (organizzazione):
United Nations Industrial Development Organization, International Yearbook of Industrial Statistics.
Categorie:
Economy & Growth
sono stati aggiornati
23 apr 2017 anni
Indicatori delle variazioni dei valori per anni
In media:
42.117
Minima:
32.758
1 gen 1997 anni
Massimo:
50.376
1 gen 2008 anni
Alla data di osservazione
Valore
Variazione assoluta
La variazione rispetto al valore precedente
1 gen 1997 anni
32.758
+32.758
0.0%
1 gen 1998 anni
42.26
+9.502
29.01%
1 gen 1999 anni
38.928
-3.332
-7.88%
1 gen 2000 anni
38.493
-0.435
-1.12%
1 gen 2001 anni
41.439
+2.946
7.65%
1 gen 2002 anni
36.402
-5.037
-12.15%
1 gen 2003 anni
35.501
-0.901
-2.48%
1 gen 2004 anni
38.202
+2.701
7.61%
1 gen 2005 anni
46.3
+8.098
21.2%
1 gen 2006 anni
46.917
+0.617
1.33%
1 gen 2007 anni
48.882
+1.965
4.19%
1 gen 2008 anni
50.376
+1.494
3.06%
1 gen 2009 anni
43.683
-6.693
-13.29%
1 gen 2010 anni
44.418
+0.736
1.68%
1 gen 2011 anni
45.009
+0.591
1.33%
1 gen 2012 anni
47.268
+2.259
5.02%
1 gen 2013 anni
42.518
-4.75
-10.05%
1 gen 2014 anni
40.439
-2.08
-4.89%
1 gen 2015 anni
40.439
+0.0
0.0%
Classificazione dei paesi secondo i statistiche attuali per anni