33
/it/
AIzaSyB4mHJ5NPEv-XzF7P6NDYXjlkCWaeKw5bc
November 30, 2025
126636
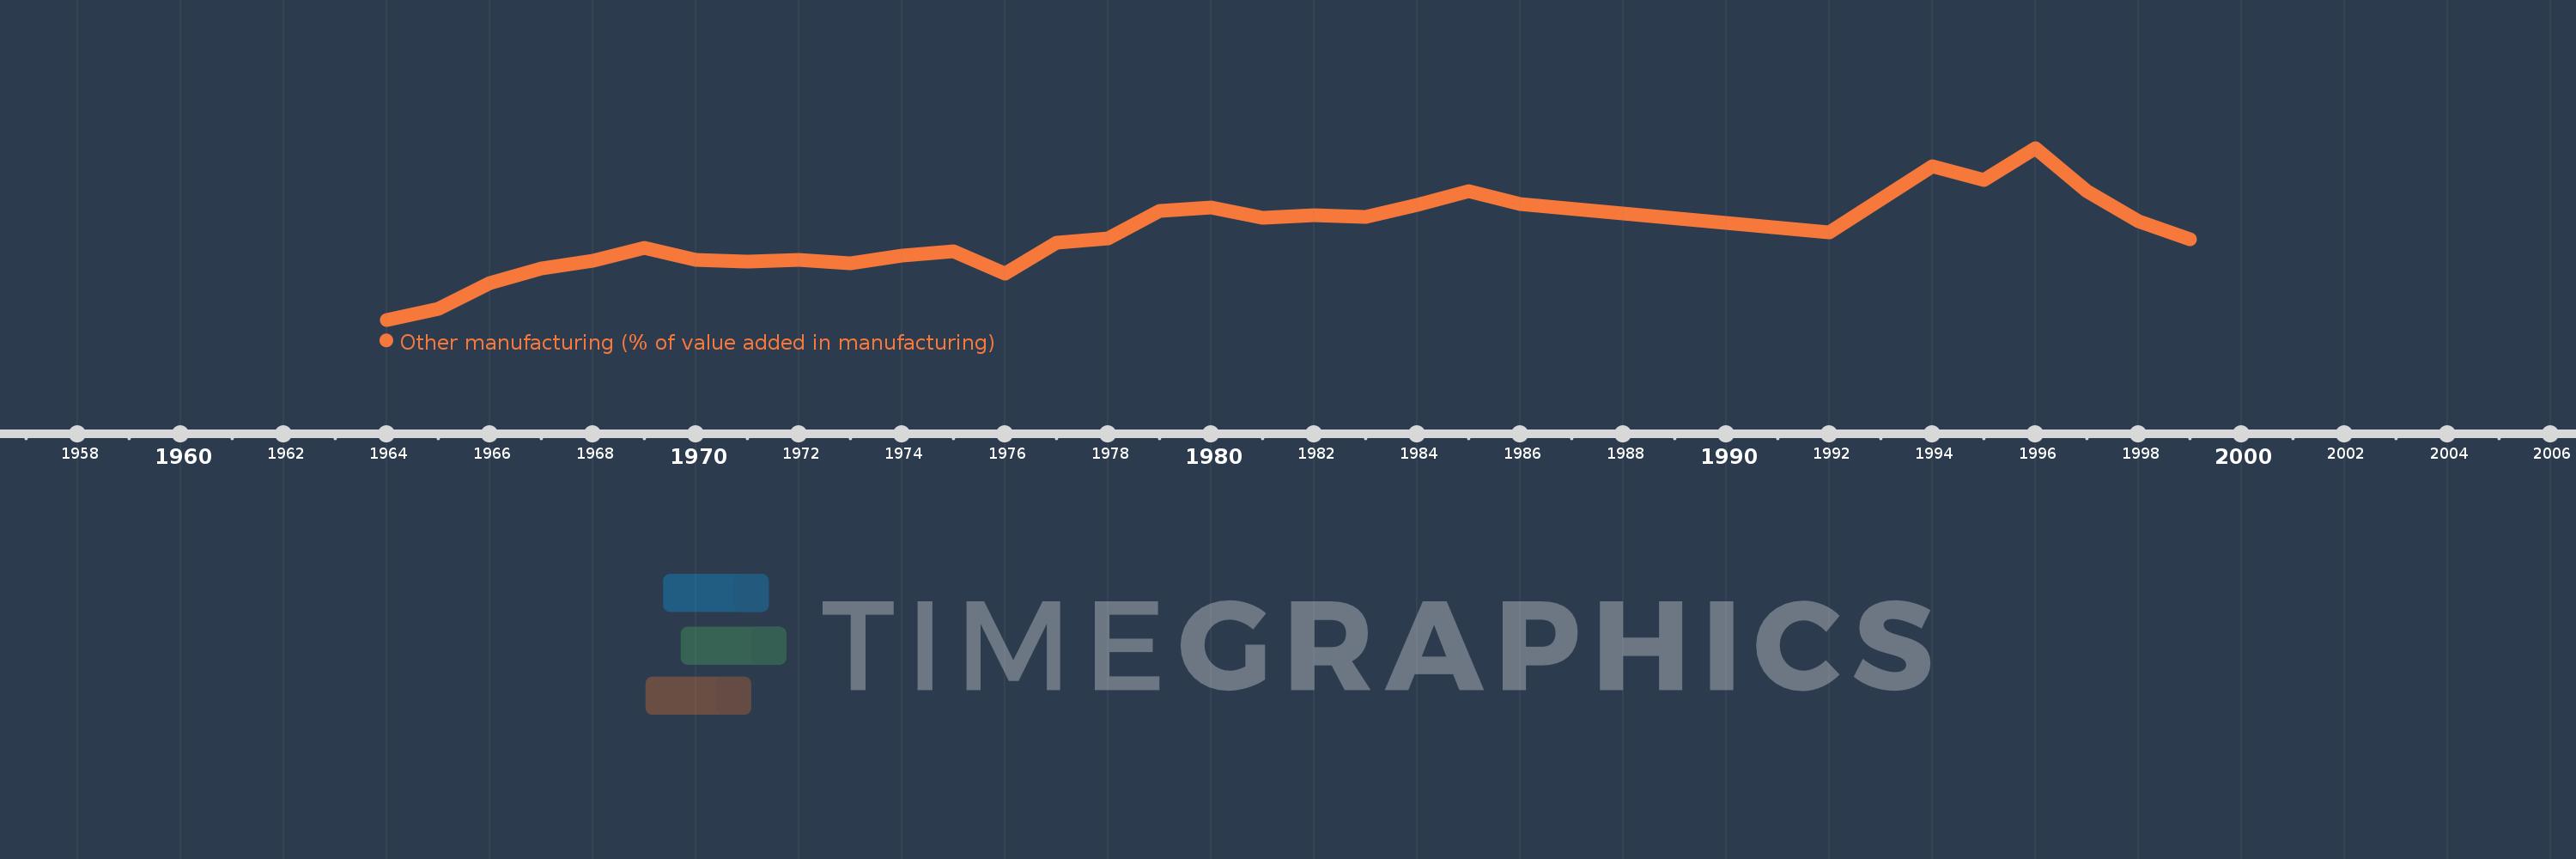
El Salvador
SLV
true
2
1
Other manufacturing (% of value added in manufacturing)
1999,1998,1997,1996,1995,1994,1992,1986,1985,1984,1983,1982,1981,1980,1979,1978,1977,1976,1975,1974,1973,1972,1971,1970,1969,1968,1967,1966,1965,1964