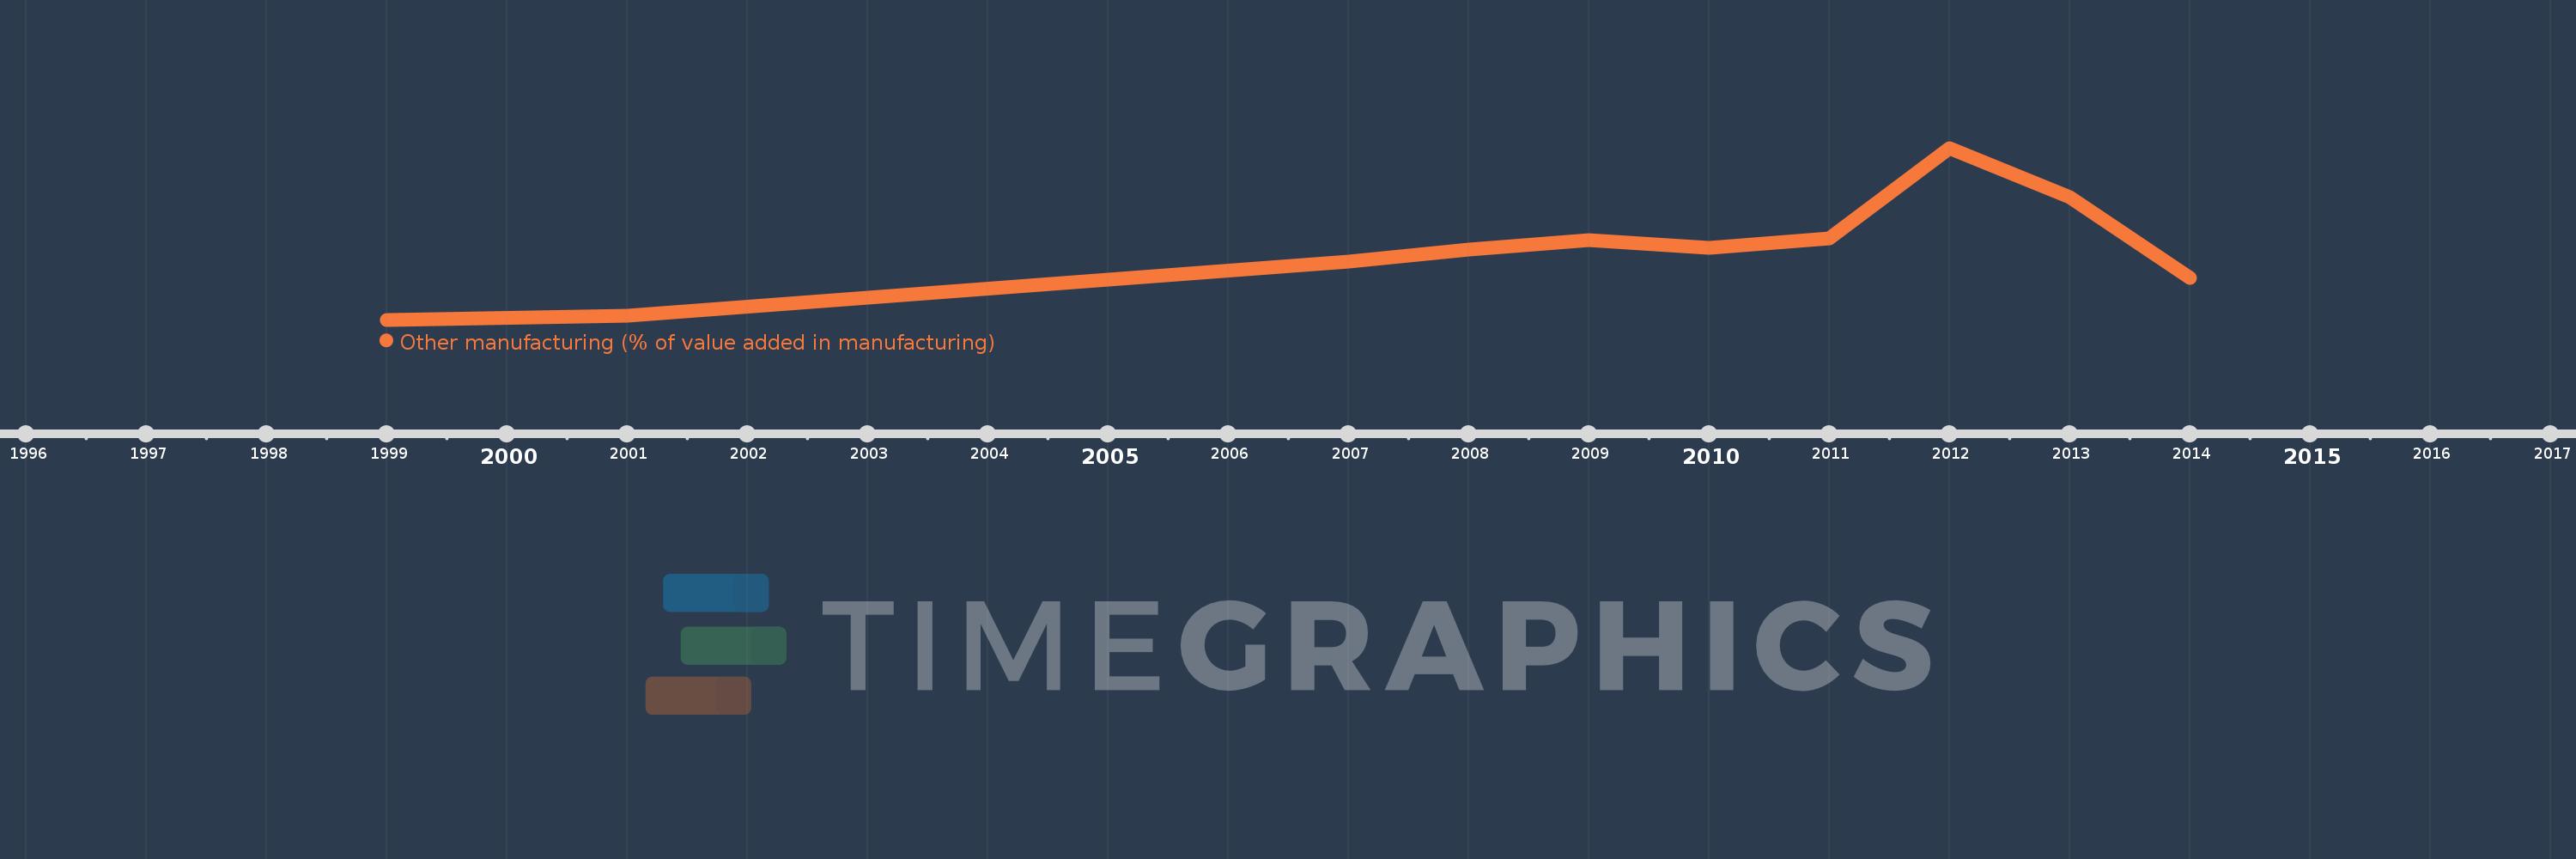
Questa scala temporale mostra un grafico dal 1999 anno al 2014 anno. Vietnam. I dati fino ad 1998 anno non disponibili. Il numero di osservazioni attuali secondo i date: 10.
La fonte (nome):
Indicatori dello sviluppo mondiale
La fonte (organizzazione):
United Nations Industrial Development Organization, International Yearbook of Industrial Statistics.
Categorie:
Economy & Growth
sono stati aggiornati
23 apr 2017 anni
Indicatori delle variazioni dei valori per anni
In media:
40.216
Minima:
30.251
1 gen 1999 anni
Massimo:
54.678
1 gen 2012 anni
Alla data di osservazione
Valore
Variazione assoluta
La variazione rispetto al valore precedente
1 gen 1999 anni
30.251
+30.251
0.0%
1 gen 2001 anni
30.774
+0.523
1.73%
1 gen 2007 anni
38.52
+7.746
25.17%
1 gen 2008 anni
40.171
+1.651
4.29%
1 gen 2009 anni
41.623
+1.452
3.61%
1 gen 2010 anni
40.468
-1.156
-2.78%
1 gen 2011 anni
41.761
+1.293
3.2%
1 gen 2012 anni
54.678
+12.917
30.93%
1 gen 2013 anni
47.691
-6.987
-12.78%
1 gen 2014 anni
36.224
-11.467
-24.04%
Classificazione dei paesi secondo i statistiche attuali per anni