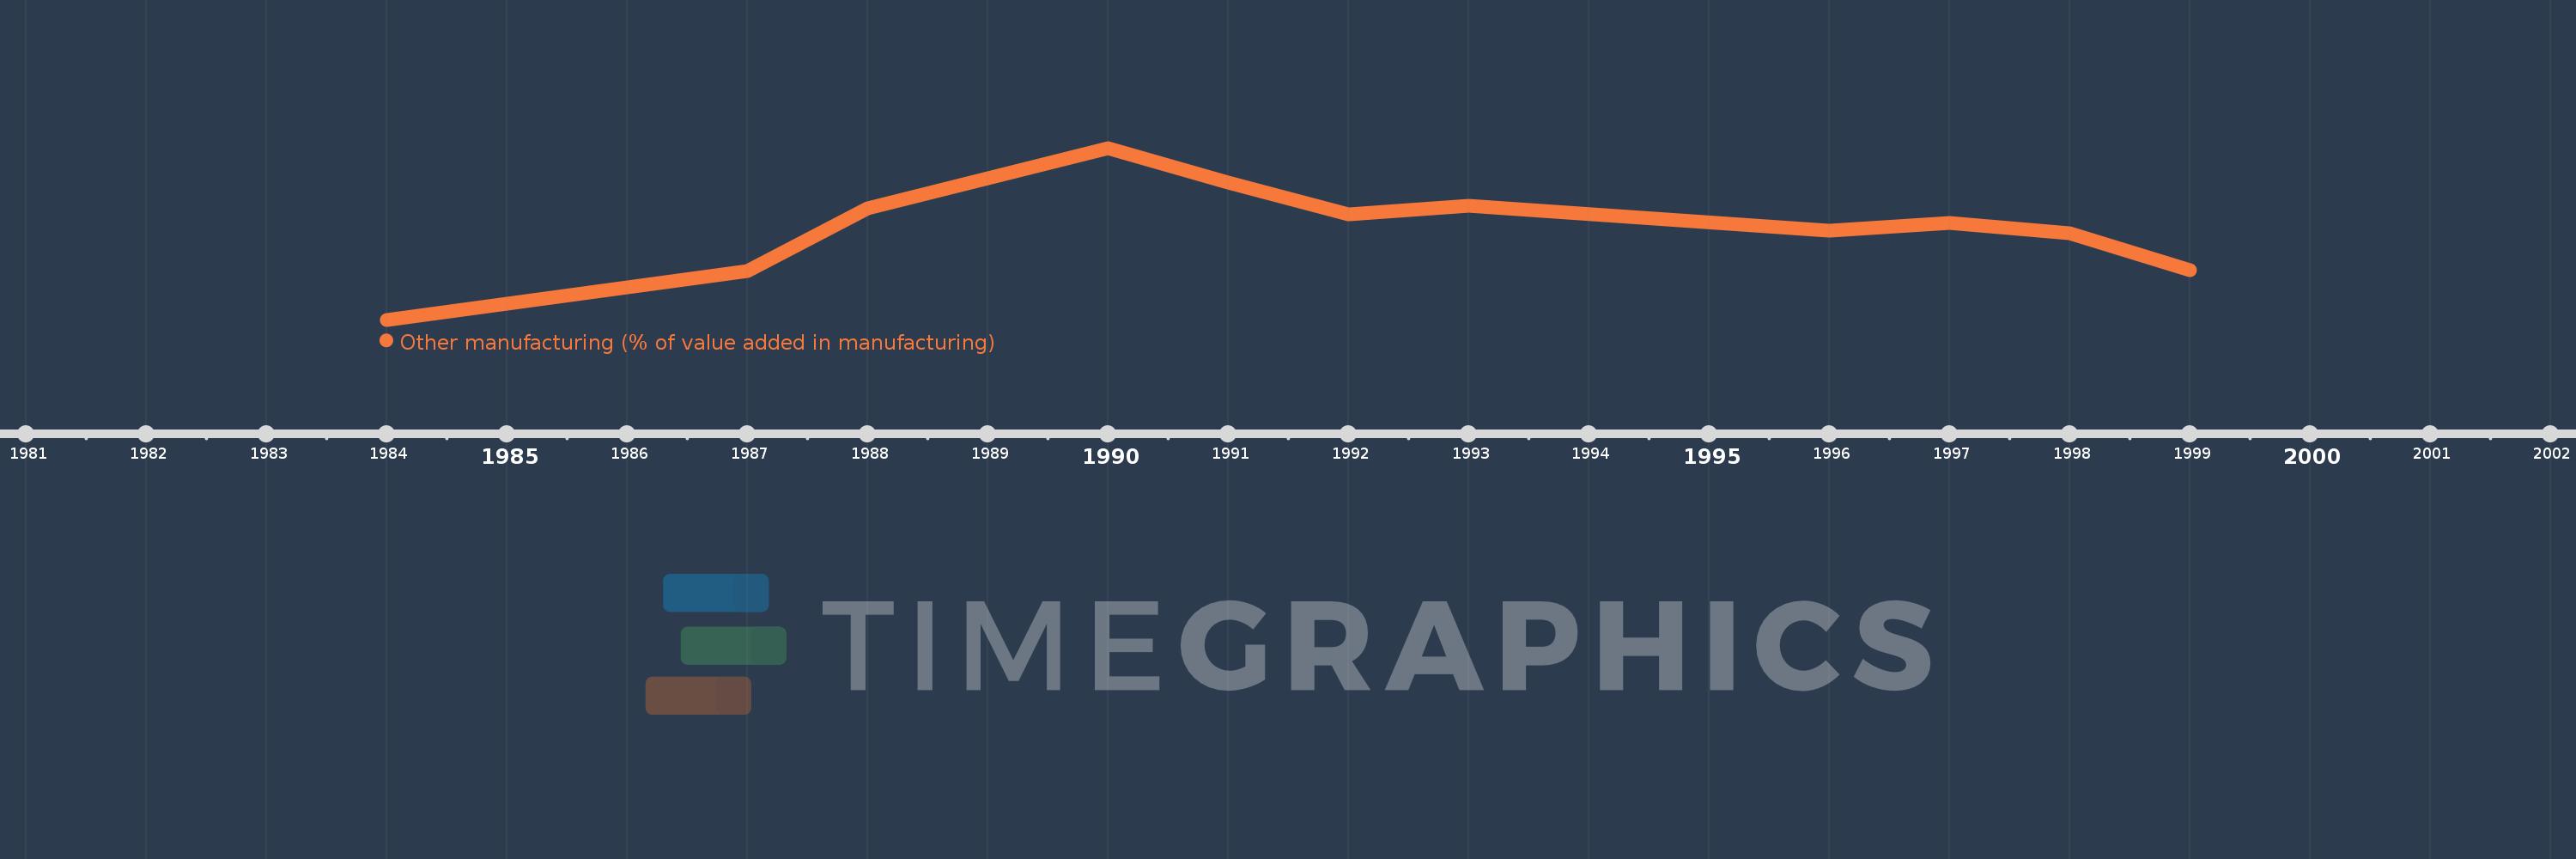
Questa scala temporale mostra un grafico dal 1984 anno al 1999 anno. Bahamas, The. I dati fino ad 1983 anno non disponibili. Il numero di osservazioni attuali secondo i date: 11.
La fonte (nome):
Indicatori dello sviluppo mondiale
La fonte (organizzazione):
United Nations Industrial Development Organization, International Yearbook of Industrial Statistics.
Categorie:
Economy & Growth
sono stati aggiornati
23 apr 2017 anni
Indicatori delle variazioni dei valori per anni
In media:
23.982
Minima:
8.357
1 gen 1984 anni
Massimo:
37.604
1 gen 1990 anni
Alla data di osservazione
Valore
Variazione assoluta
La variazione rispetto al valore precedente
1 gen 1984 anni
8.357
+8.357
0.0%
1 gen 1987 anni
16.706
+8.348
99.9%
1 gen 1988 anni
27.318
+10.613
63.53%
1 gen 1990 anni
37.604
+10.286
37.65%
1 gen 1991 anni
31.645
-5.959
-15.85%
1 gen 1992 anni
26.31
-5.335
-16.86%
1 gen 1993 anni
27.783
+1.473
5.6%
1 gen 1996 anni
23.504
-4.278
-15.4%
1 gen 1997 anni
24.765
+1.26
5.36%
1 gen 1998 anni
23.035
-1.73
-6.99%
1 gen 1999 anni
16.78
-6.254
-27.15%
Classificazione dei paesi secondo i statistiche attuali per anni