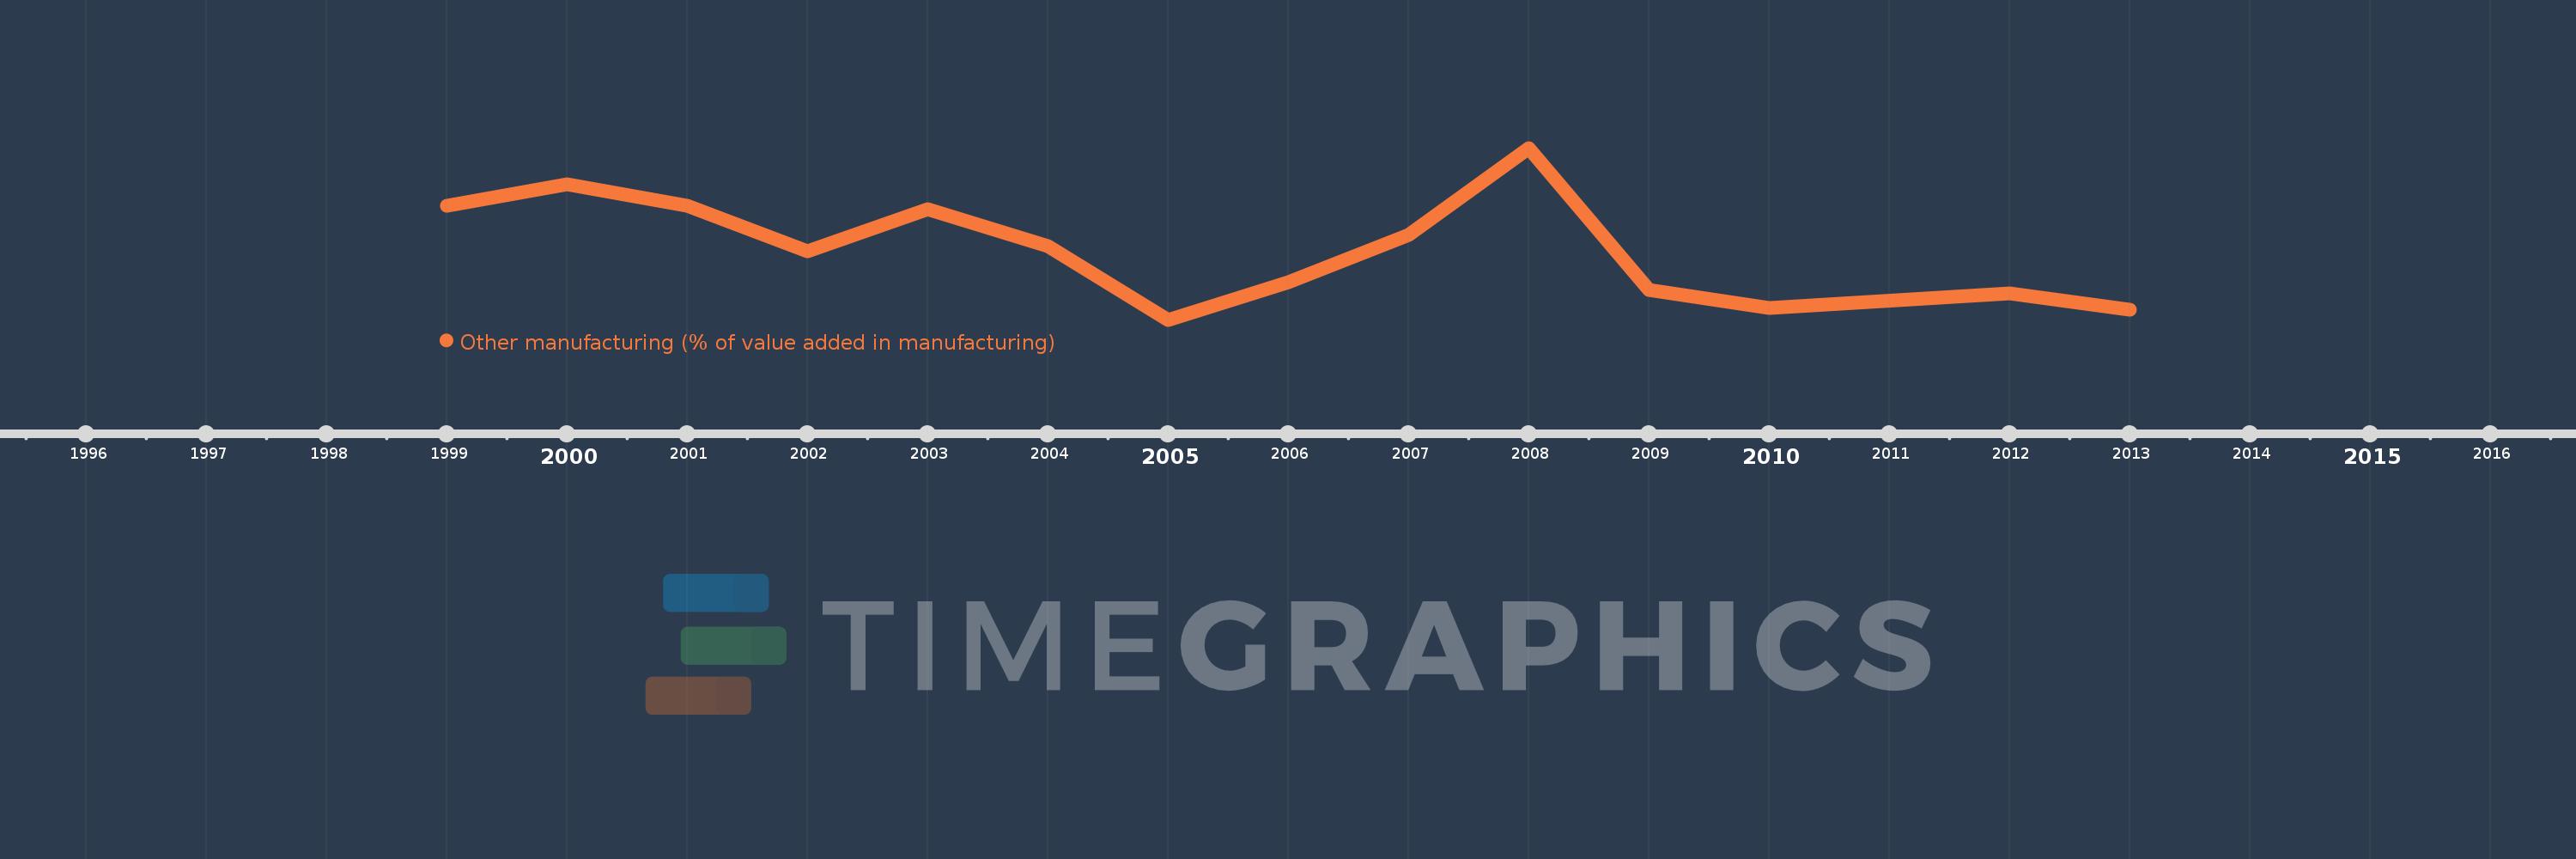
Questa scala temporale mostra un grafico dal 1999 anno al 2013 anno. Yemen, Rep.. I dati fino ad 1998 anno non disponibili. Il numero di osservazioni attuali secondo i date: 14.
La fonte (nome):
Indicatori dello sviluppo mondiale
La fonte (organizzazione):
United Nations Industrial Development Organization, International Yearbook of Industrial Statistics.
Categorie:
Economy & Growth
sono stati aggiornati
23 apr 2017 anni
Indicatori delle variazioni dei valori per anni
In media:
42.864
Minima:
34.865
1 gen 2005 anni
Massimo:
54.316
1 gen 2008 anni
Alla data di osservazione
Valore
Variazione assoluta
La variazione rispetto al valore precedente
1 gen 1999 anni
47.782
+47.782
0.0%
1 gen 2000 anni
50.216
+2.434
5.09%
1 gen 2001 anni
47.725
-2.491
-4.96%
1 gen 2002 anni
42.663
-5.062
-10.61%
1 gen 2003 anni
47.363
+4.7
11.02%
1 gen 2004 anni
43.239
-4.124
-8.71%
1 gen 2005 anni
34.865
-8.374
-19.37%
1 gen 2006 anni
39.128
+4.263
12.23%
1 gen 2007 anni
44.461
+5.333
13.63%
1 gen 2008 anni
54.316
+9.856
22.17%
1 gen 2009 anni
38.288
-16.028
-29.51%
1 gen 2010 anni
36.239
-2.049
-5.35%
1 gen 2012 anni
37.859
+1.62
4.47%
1 gen 2013 anni
35.956
-1.904
-5.03%
Classificazione dei paesi secondo i statistiche attuali per anni