33
/it/
AIzaSyB4mHJ5NPEv-XzF7P6NDYXjlkCWaeKw5bc
November 30, 2025
102839
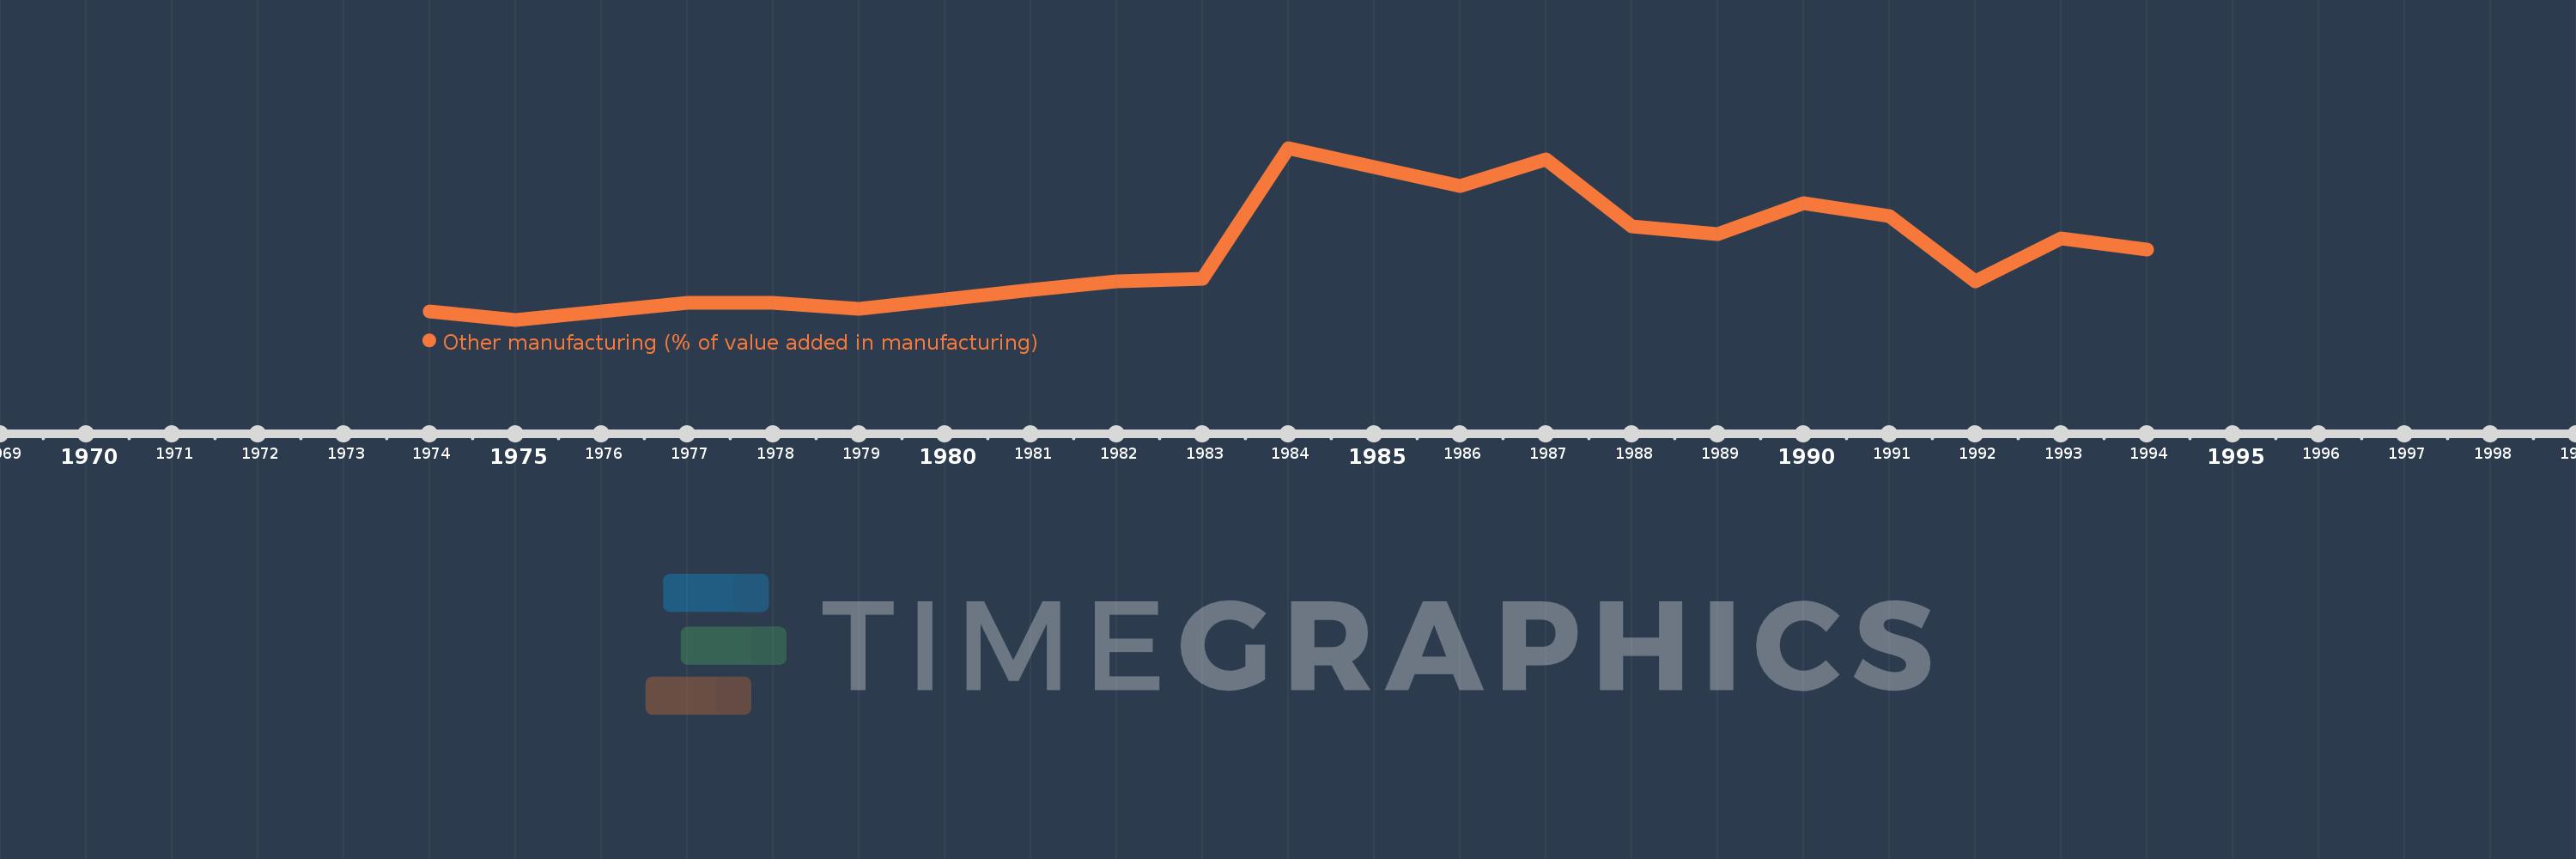
Central African Republic
CAF
true
2
1
Other manufacturing (% of value added in manufacturing)
1994,1993,1992,1991,1990,1989,1988,1987,1986,1984,1983,1982,1981,1979,1978,1977,1976,1975,1974