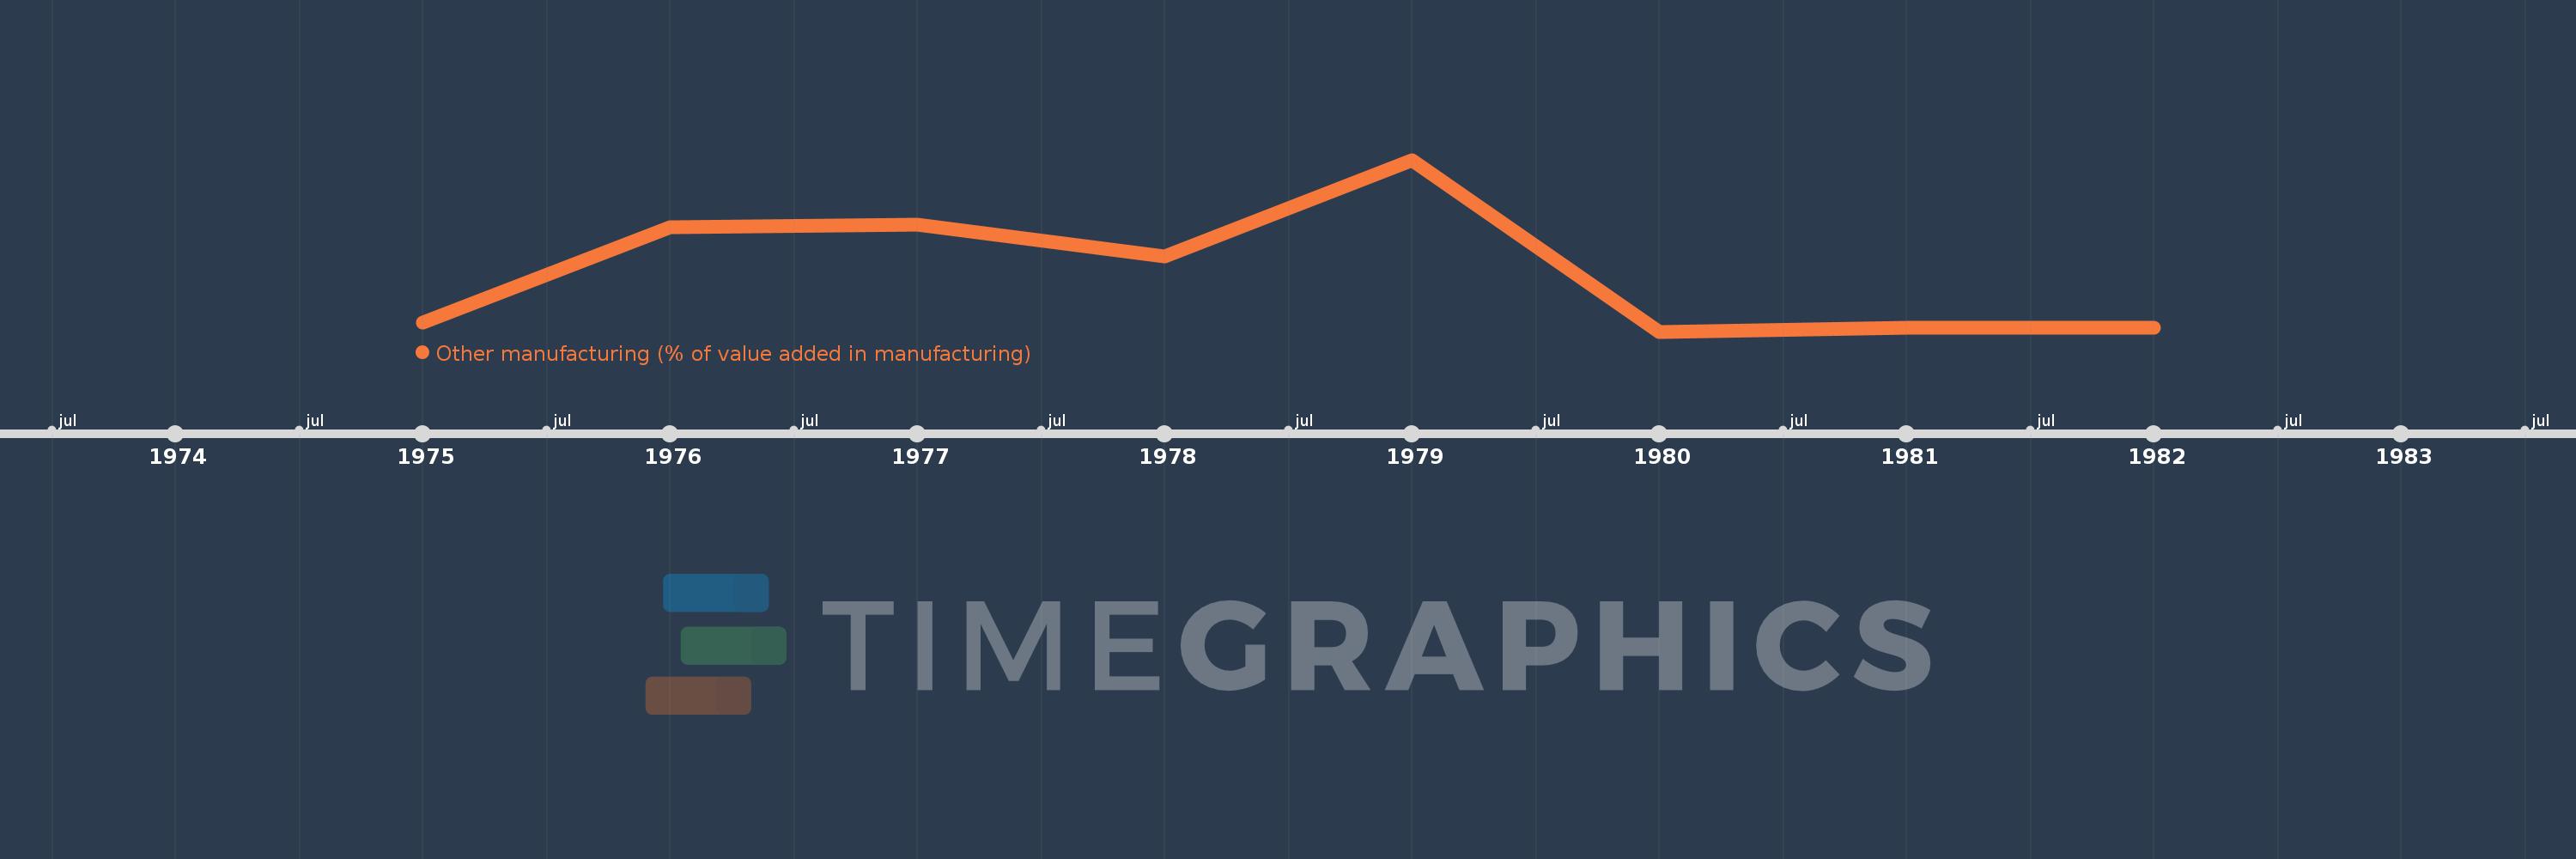
Questa scala temporale mostra un grafico dal 1975 anno al 1982 anno. Benin. I dati fino ad 1974 anno non disponibili. Il numero di osservazioni attuali secondo i date: 8.
La fonte (nome):
Indicatori dello sviluppo mondiale
La fonte (organizzazione):
United Nations Industrial Development Organization, International Yearbook of Industrial Statistics.
Categorie:
Economy & Growth
sono stati aggiornati
23 apr 2017 anni
Indicatori delle variazioni dei valori per anni
In media:
21.645
Minima:
20.57
1 gen 1980 anni
Massimo:
23.69
1 gen 1979 anni
Alla data di osservazione
Valore
Variazione assoluta
La variazione rispetto al valore precedente
1 gen 1975 anni
20.728
+20.728
0.0%
1 gen 1976 anni
22.458
+1.73
8.35%
1 gen 1977 anni
22.506
+0.048
0.21%
1 gen 1978 anni
21.938
-0.568
-2.52%
1 gen 1979 anni
23.69
+1.752
7.98%
1 gen 1980 anni
20.57
-3.119
-13.17%
1 gen 1981 anni
20.636
+0.066
0.32%
1 gen 1982 anni
20.636
+0.0
0.0%
Classificazione dei paesi secondo i statistiche attuali per anni