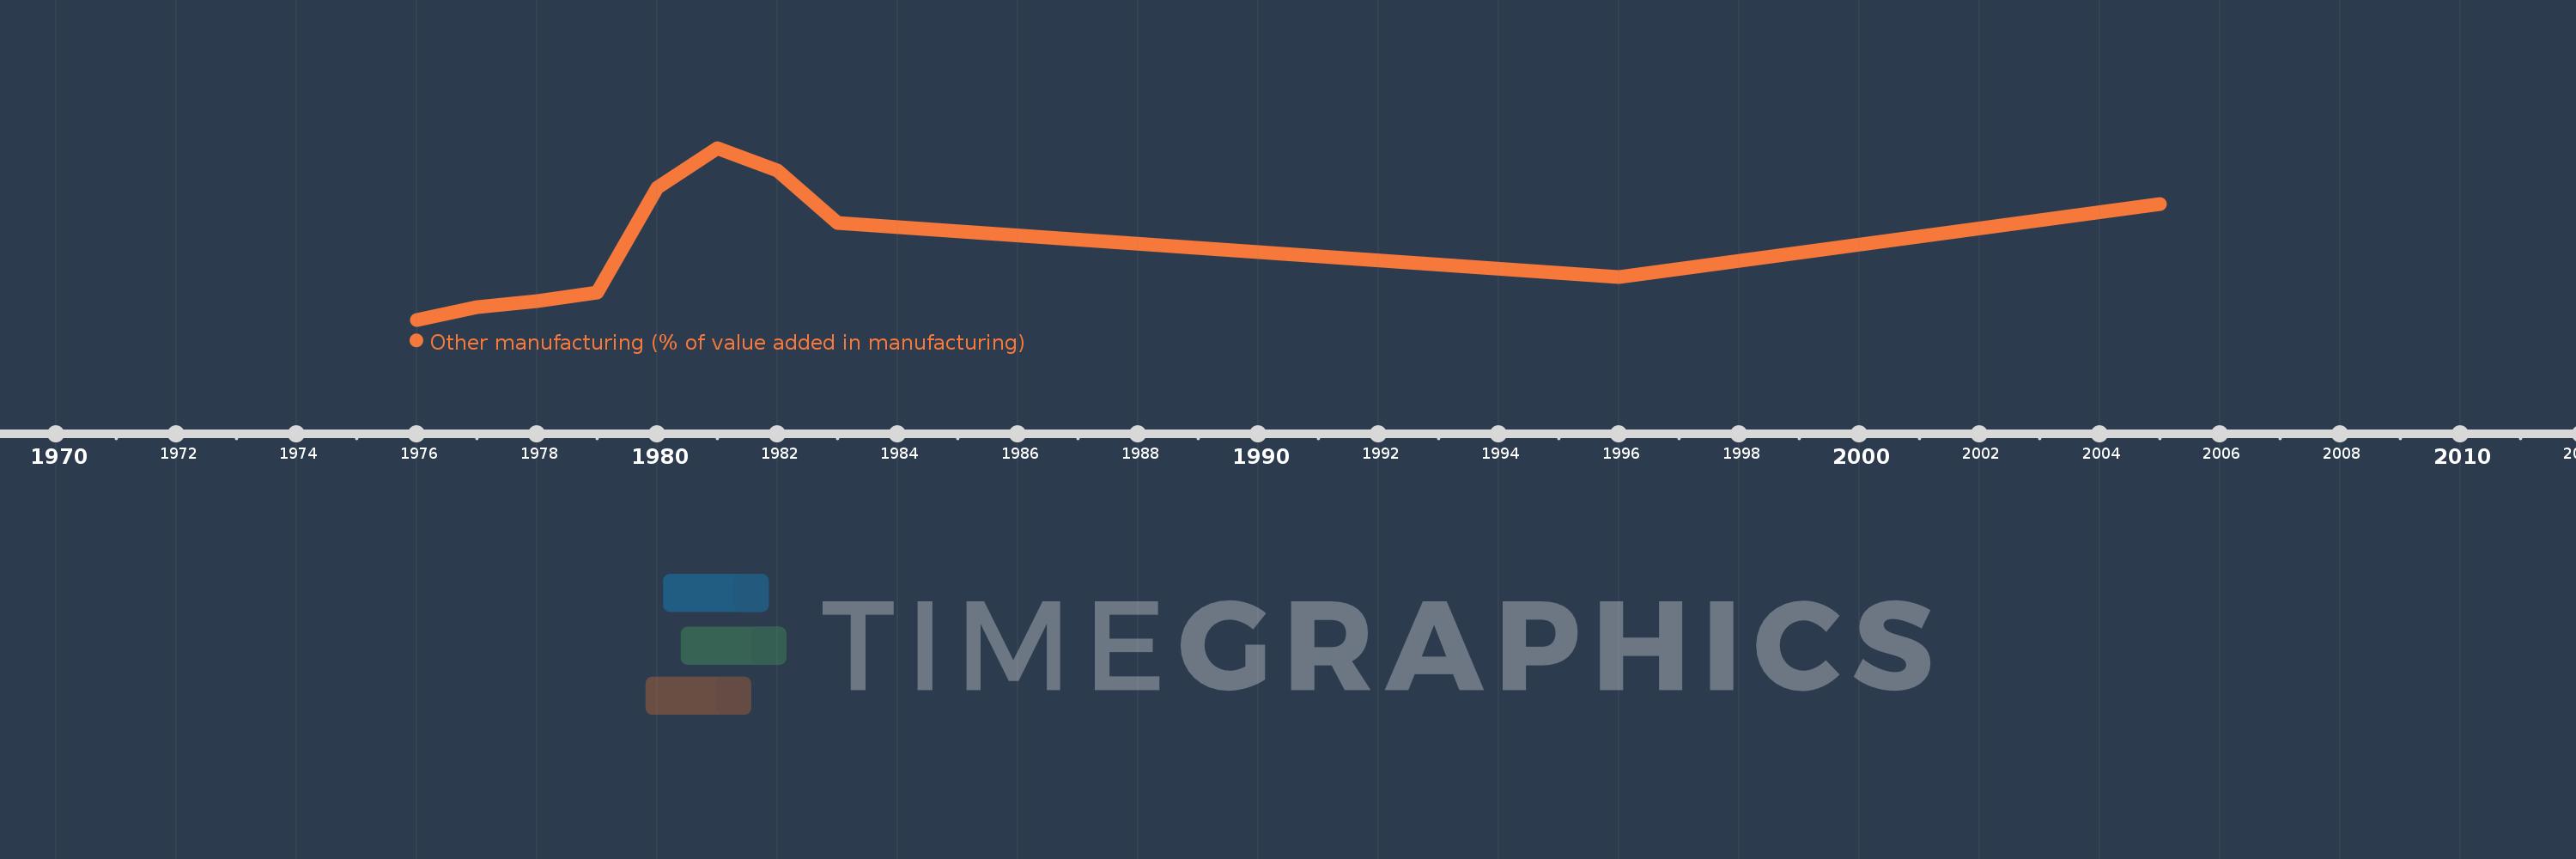
Questa scala temporale mostra un grafico dal 1976 anno al 2005 anno. Gambia, The. I dati fino ad 1975 anno non disponibili. Il numero di osservazioni attuali secondo i date: 10.
La fonte (nome):
Indicatori dello sviluppo mondiale
La fonte (organizzazione):
United Nations Industrial Development Organization, International Yearbook of Industrial Statistics.
Categorie:
Economy & Growth
sono stati aggiornati
23 apr 2017 anni
Indicatori delle variazioni dei valori per anni
In media:
28.234
Minima:
2.917
1 gen 1976 anni
Massimo:
59.591
1 gen 1981 anni
Alla data di osservazione
Valore
Variazione assoluta
La variazione rispetto al valore precedente
1 gen 1976 anni
2.917
+2.917
0.0%
1 gen 1977 anni
7.118
+4.2
143.99%
1 gen 1978 anni
8.937
+1.819
25.56%
1 gen 1979 anni
11.948
+3.012
33.7%
1 gen 1980 anni
46.506
+34.557
289.22%
1 gen 1981 anni
59.591
+13.085
28.14%
1 gen 1982 anni
52.156
-7.435
-12.48%
1 gen 1983 anni
34.986
-17.171
-32.92%
1 gen 1996 anni
17.073
-17.913
-51.2%
1 gen 2005 anni
41.107
+24.033
140.77%
Classificazione dei paesi secondo i statistiche attuali per anni