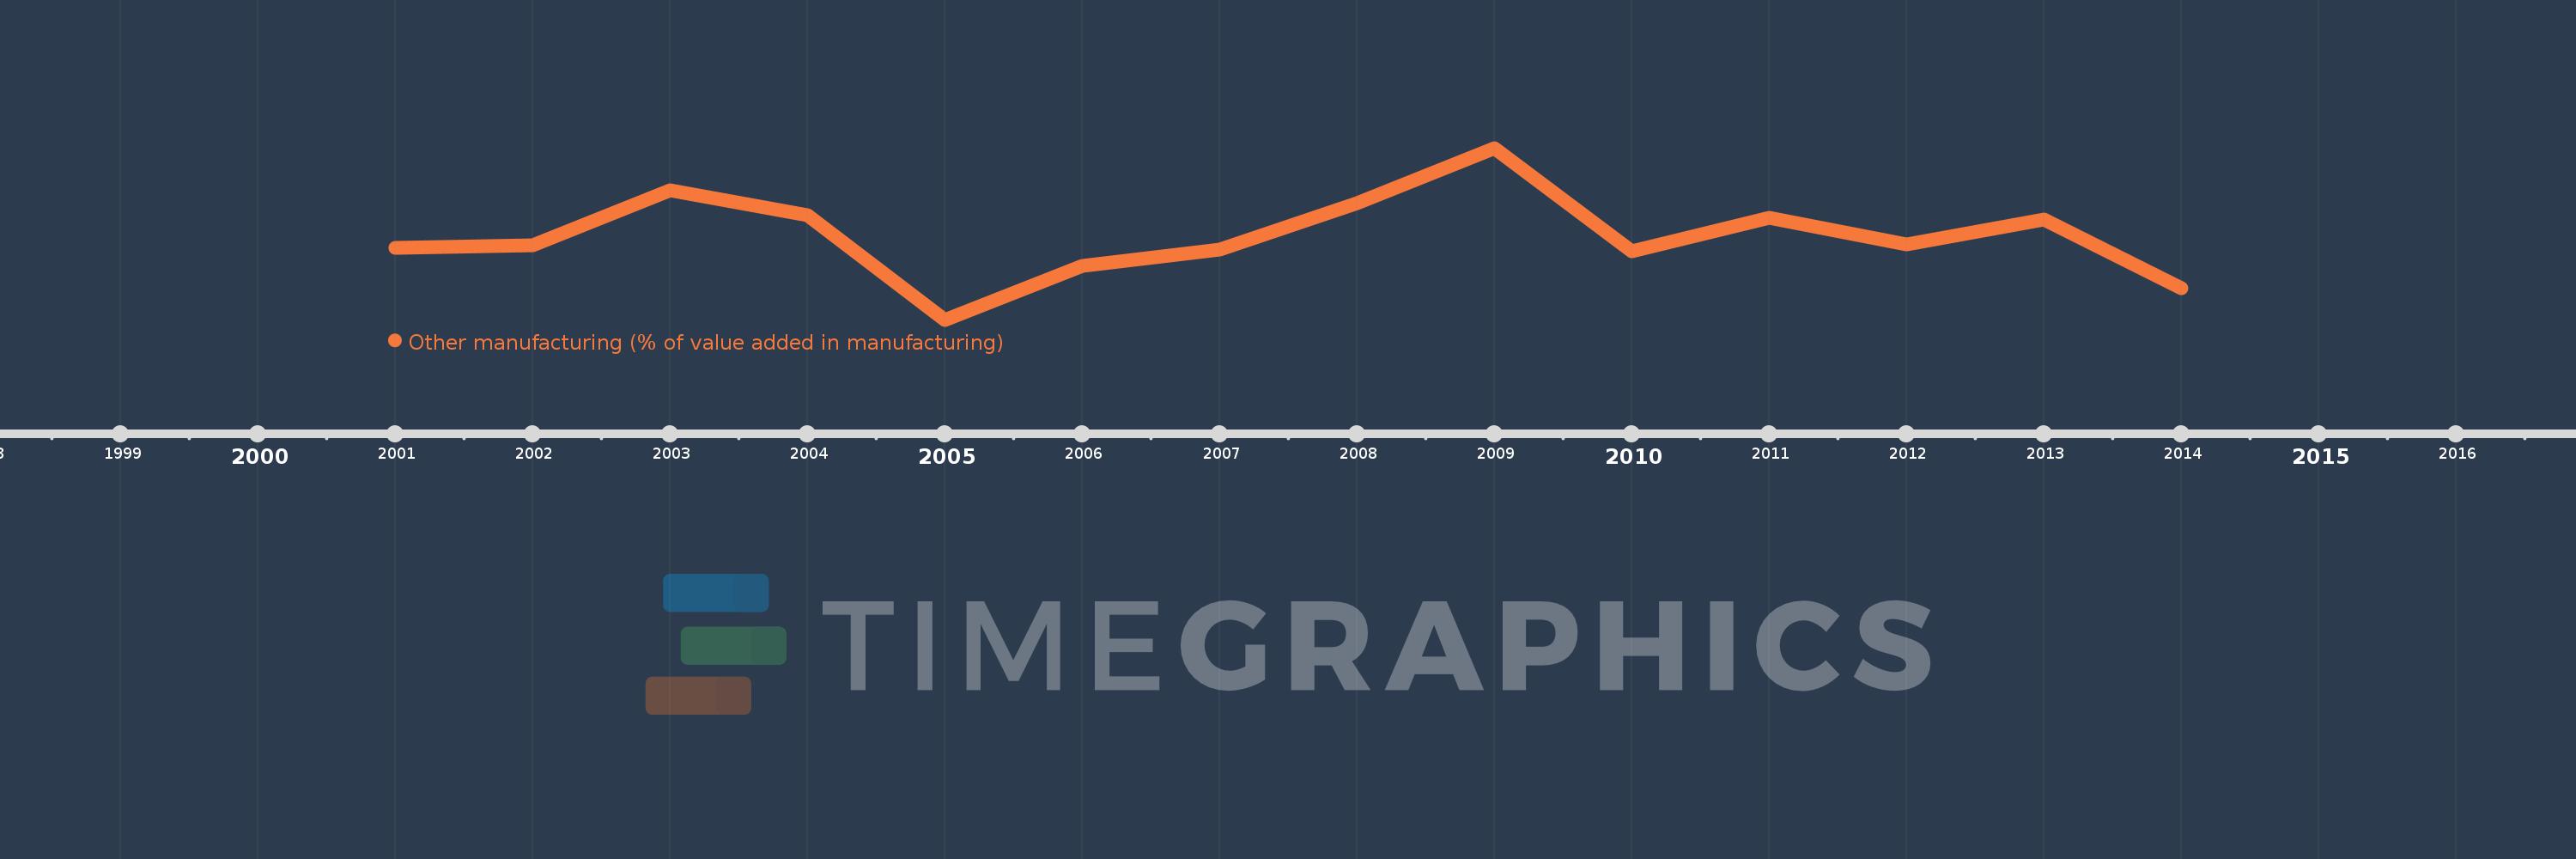
Questa scala temporale mostra un grafico dal 2001 anno al 2014 anno. Georgia. I dati fino ad 2000 anno non disponibili. Il numero di osservazioni attuali secondo i date: 14.
La fonte (nome):
Indicatori dello sviluppo mondiale
La fonte (organizzazione):
United Nations Industrial Development Organization, International Yearbook of Industrial Statistics.
Categorie:
Economy & Growth
sono stati aggiornati
23 apr 2017 anni
Indicatori delle variazioni dei valori per anni
In media:
44.754
Minima:
30.873
1 gen 2005 anni
Massimo:
59.408
1 gen 2009 anni
Alla data di osservazione
Valore
Variazione assoluta
La variazione rispetto al valore precedente
1 gen 2001 anni
42.78
+42.78
0.0%
1 gen 2002 anni
43.269
+0.488
1.14%
1 gen 2003 anni
52.334
+9.065
20.95%
1 gen 2004 anni
48.277
-4.057
-7.75%
1 gen 2005 anni
30.873
-17.403
-36.05%
1 gen 2006 anni
39.824
+8.951
28.99%
1 gen 2007 anni
42.522
+2.698
6.78%
1 gen 2008 anni
50.174
+7.651
17.99%
1 gen 2009 anni
59.408
+9.234
18.4%
1 gen 2010 anni
42.224
-17.184
-28.93%
1 gen 2011 anni
47.831
+5.607
13.28%
1 gen 2012 anni
43.391
-4.439
-9.28%
1 gen 2013 anni
47.582
+4.191
9.66%
1 gen 2014 anni
36.063
-11.519
-24.21%
Classificazione dei paesi secondo i statistiche attuali per anni