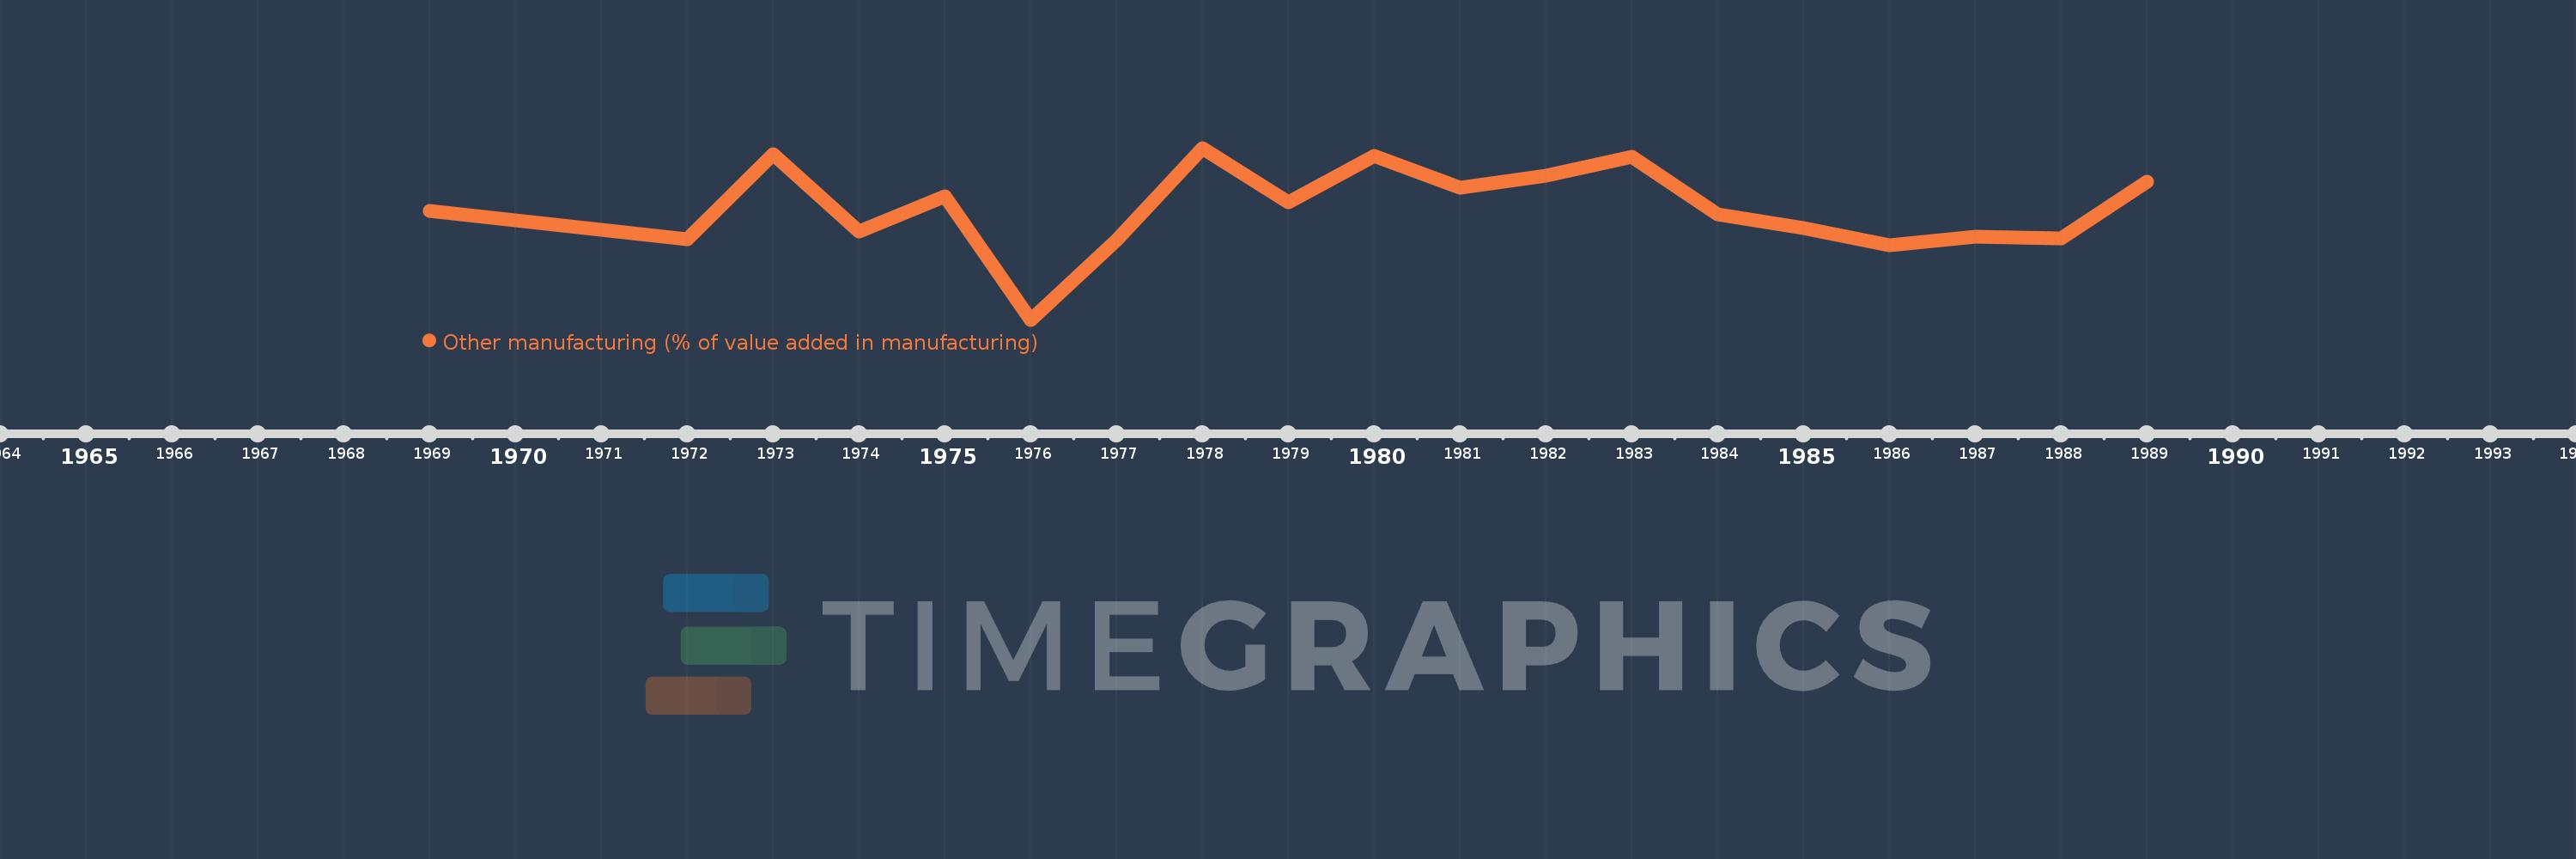
Questa scala temporale mostra un grafico dal 1969 anno al 1989 anno. Guatemala. I dati fino ad 1968 anno non disponibili. Il numero di osservazioni attuali secondo i date: 19.
La fonte (nome):
Indicatori dello sviluppo mondiale
La fonte (organizzazione):
United Nations Industrial Development Organization, International Yearbook of Industrial Statistics.
Categorie:
Economy & Growth
sono stati aggiornati
23 apr 2017 anni
Indicatori delle variazioni dei valori per anni
In media:
30.971
Minima:
27.464
1 gen 1976 anni
Massimo:
32.881
1 gen 1978 anni
Alla data di osservazione
Valore
Variazione assoluta
La variazione rispetto al valore precedente
1 gen 1969 anni
30.906
+30.906
0.0%
1 gen 1972 anni
29.998
-0.908
-2.94%
1 gen 1973 anni
32.687
+2.689
8.96%
1 gen 1974 anni
30.249
-2.438
-7.46%
1 gen 1975 anni
31.346
+1.097
3.63%
1 gen 1976 anni
27.464
-3.882
-12.39%
1 gen 1977 anni
29.988
+2.524
9.19%
1 gen 1978 anni
32.881
+2.893
9.65%
1 gen 1979 anni
31.161
-1.72
-5.23%
1 gen 1980 anni
32.629
+1.468
4.71%
1 gen 1981 anni
31.638
-0.991
-3.04%
1 gen 1982 anni
32.004
+0.367
1.16%
1 gen 1983 anni
32.609
+0.605
1.89%
1 gen 1984 anni
30.777
-1.833
-5.62%
1 gen 1985 anni
30.356
-0.42
-1.37%
1 gen 1986 anni
29.81
-0.546
-1.8%
1 gen 1987 anni
30.09
+0.28
0.94%
1 gen 1988 anni
30.034
-0.056
-0.19%
1 gen 1989 anni
31.812
+1.778
5.92%
Classificazione dei paesi secondo i statistiche attuali per anni