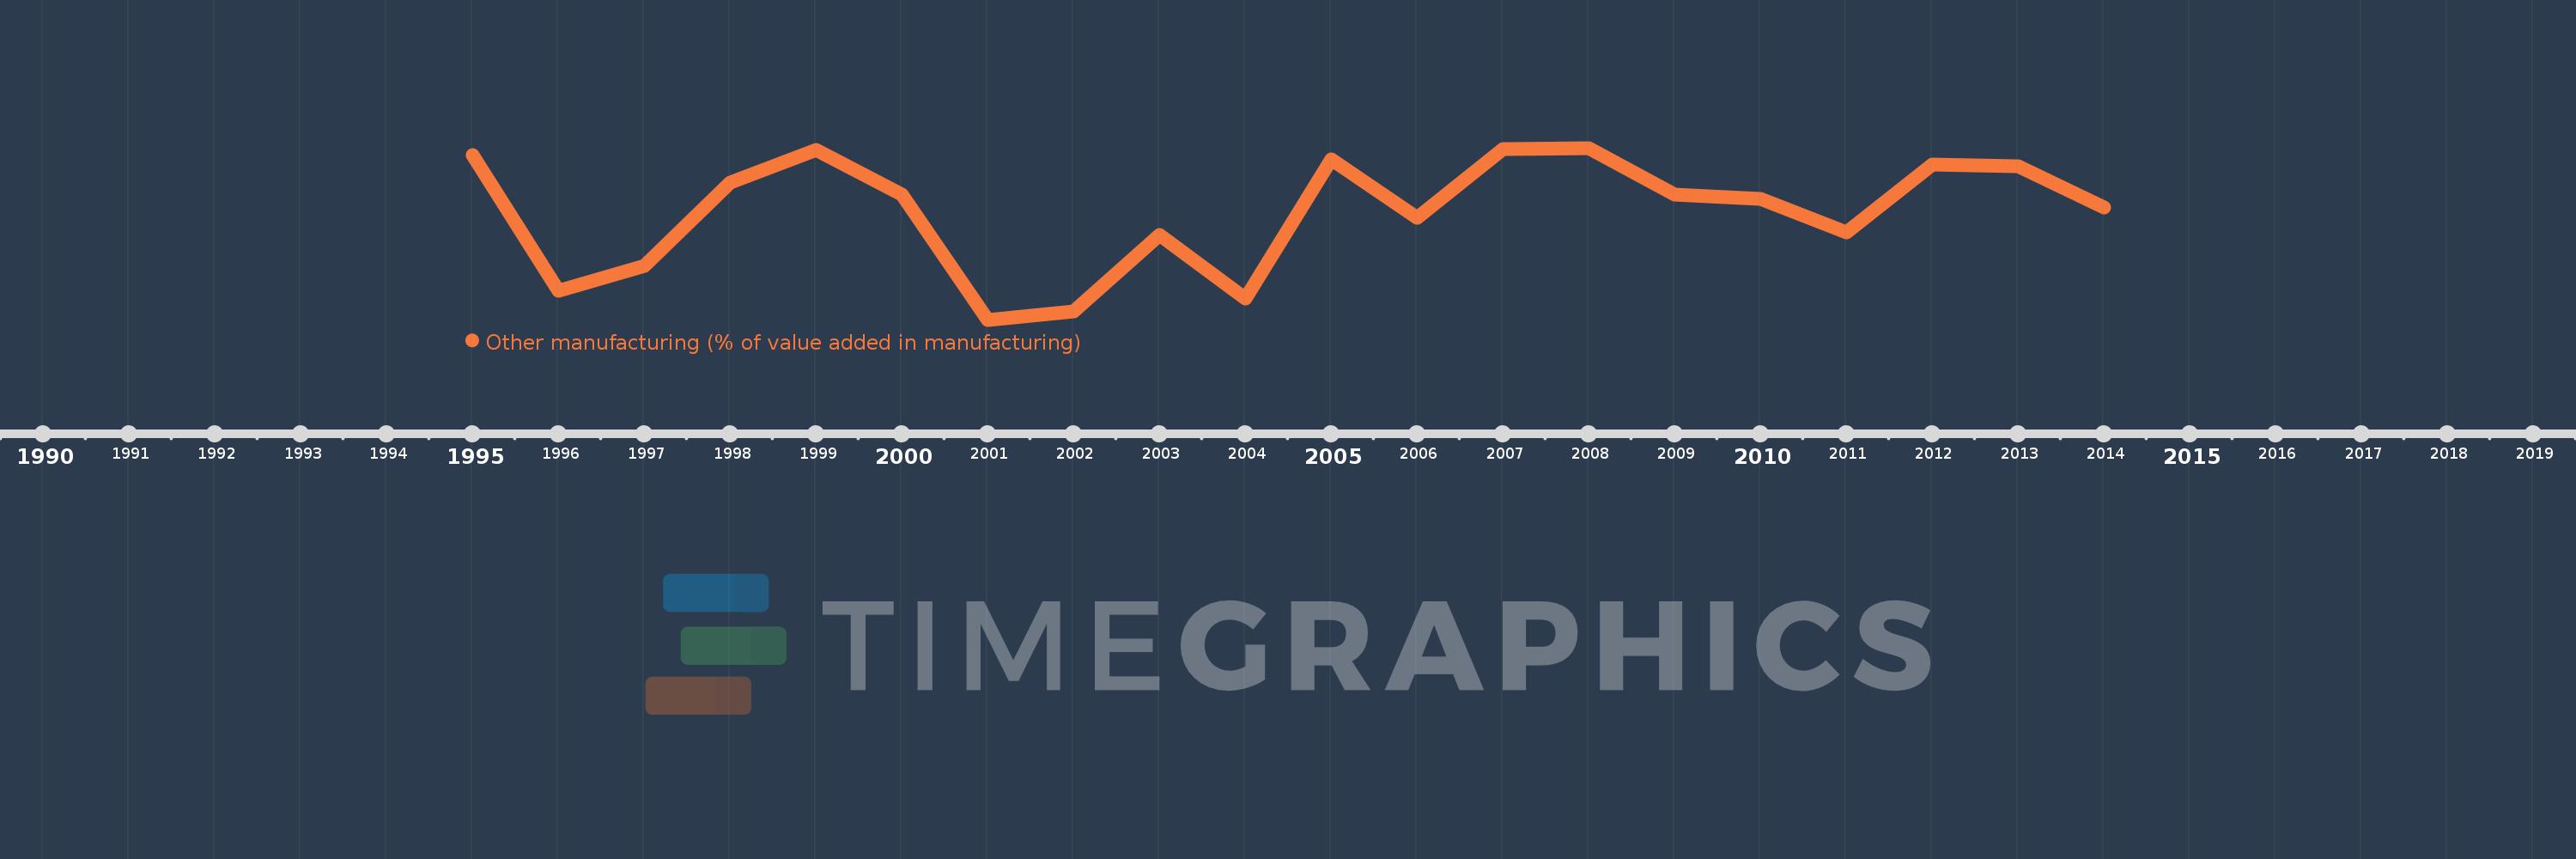
Questa scala temporale mostra un grafico dal 1995 anno al 2014 anno. West Bank and Gaza. I dati fino ad 1994 anno non disponibili. Il numero di osservazioni attuali secondo i date: 20.
La fonte (nome):
Indicatori dello sviluppo mondiale
La fonte (organizzazione):
United Nations Industrial Development Organization, International Yearbook of Industrial Statistics.
Categorie:
Economy & Growth
sono stati aggiornati
23 apr 2017 anni
Indicatori delle variazioni dei valori per anni
In media:
50.249
Minima:
41.483
1 gen 2001 anni
Massimo:
55.474
1 gen 2008 anni
Alla data di osservazione
Valore
Variazione assoluta
La variazione rispetto al valore precedente
1 gen 1995 anni
54.928
+54.928
0.0%
1 gen 1996 anni
43.816
-11.112
-20.23%
1 gen 1997 anni
45.903
+2.086
4.76%
1 gen 1998 anni
52.628
+6.726
14.65%
1 gen 1999 anni
55.298
+2.67
5.07%
1 gen 2000 anni
51.674
-3.624
-6.55%
1 gen 2001 anni
41.483
-10.191
-19.72%
1 gen 2002 anni
42.143
+0.66
1.59%
1 gen 2003 anni
48.365
+6.222
14.76%
1 gen 2004 anni
43.177
-5.188
-10.73%
1 gen 2005 anni
54.569
+11.392
26.38%
1 gen 2006 anni
49.795
-4.775
-8.75%
1 gen 2007 anni
55.389
+5.594
11.23%
1 gen 2008 anni
55.474
+0.085
0.15%
1 gen 2009 anni
51.695
-3.78
-6.81%
1 gen 2010 anni
51.352
-0.343
-0.66%
1 gen 2011 anni
48.572
-2.78
-5.41%
1 gen 2012 anni
54.099
+5.526
11.38%
1 gen 2013 anni
53.994
-0.105
-0.19%
1 gen 2014 anni
50.634
-3.36
-6.22%
Classificazione dei paesi secondo i statistiche attuali per anni