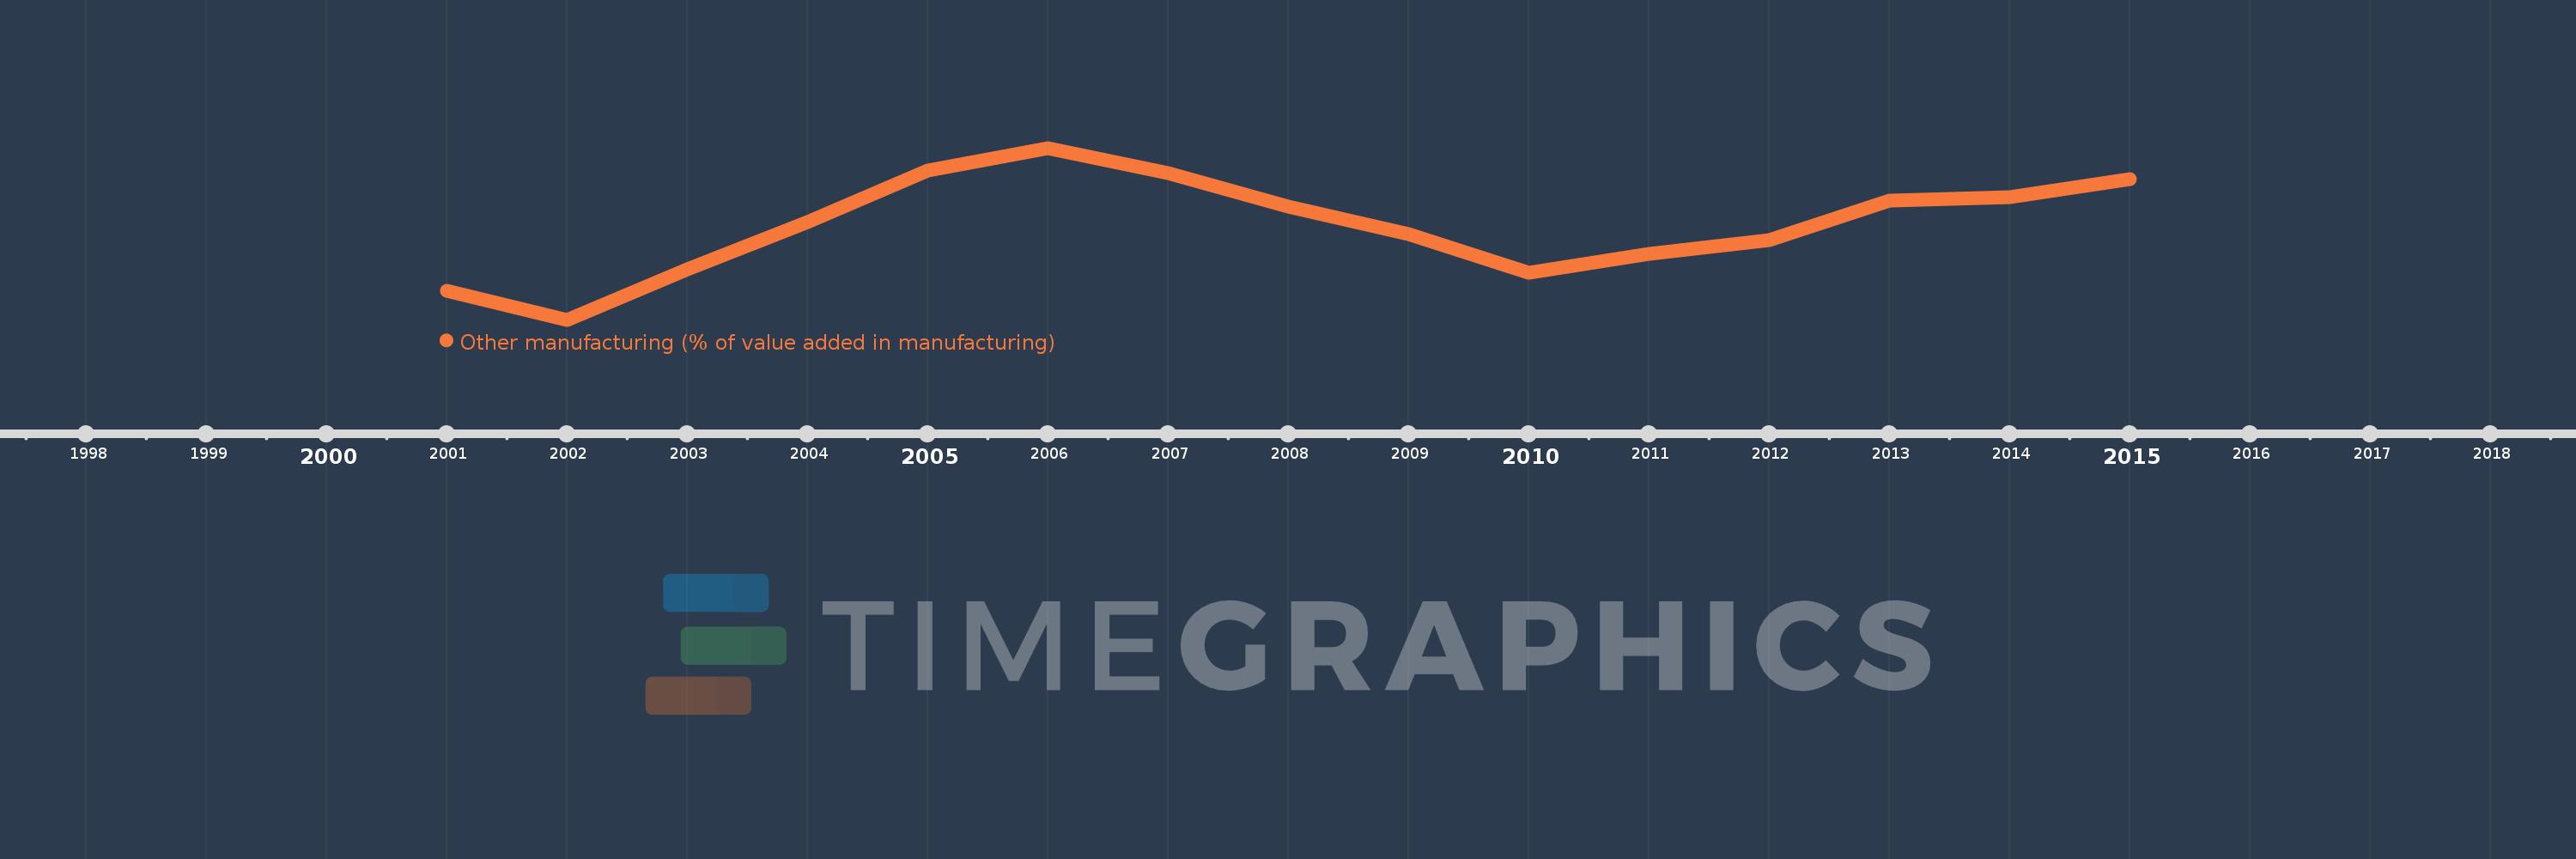
Questa scala temporale mostra un grafico dal 2001 anno al 2015 anno. Lithuania. I dati fino ad 2000 anno non disponibili. Il numero di osservazioni attuali secondo i date: 15.
La fonte (nome):
Indicatori dello sviluppo mondiale
La fonte (organizzazione):
United Nations Industrial Development Organization, International Yearbook of Industrial Statistics.
Categorie:
Economy & Growth
sono stati aggiornati
23 apr 2017 anni
Indicatori delle variazioni dei valori per anni
In media:
46.639
Minima:
37.56
1 gen 2002 anni
Massimo:
54.06
1 gen 2006 anni
Alla data di osservazione
Valore
Variazione assoluta
La variazione rispetto al valore precedente
1 gen 2001 anni
40.334
+40.334
0.0%
1 gen 2002 anni
37.56
-2.773
-6.88%
1 gen 2003 anni
42.366
+4.805
12.79%
1 gen 2004 anni
46.935
+4.57
10.79%
1 gen 2005 anni
51.852
+4.917
10.48%
1 gen 2006 anni
54.06
+2.209
4.26%
1 gen 2007 anni
51.629
-2.432
-4.5%
1 gen 2008 anni
48.41
-3.219
-6.23%
1 gen 2009 anni
45.757
-2.653
-5.48%
1 gen 2010 anni
42.079
-3.678
-8.04%
1 gen 2011 anni
43.918
+1.839
4.37%
1 gen 2012 anni
45.199
+1.282
2.92%
1 gen 2013 anni
49.039
+3.839
8.49%
1 gen 2014 anni
49.365
+0.326
0.67%
1 gen 2015 anni
51.088
+1.723
3.49%
Classificazione dei paesi secondo i statistiche attuali per anni