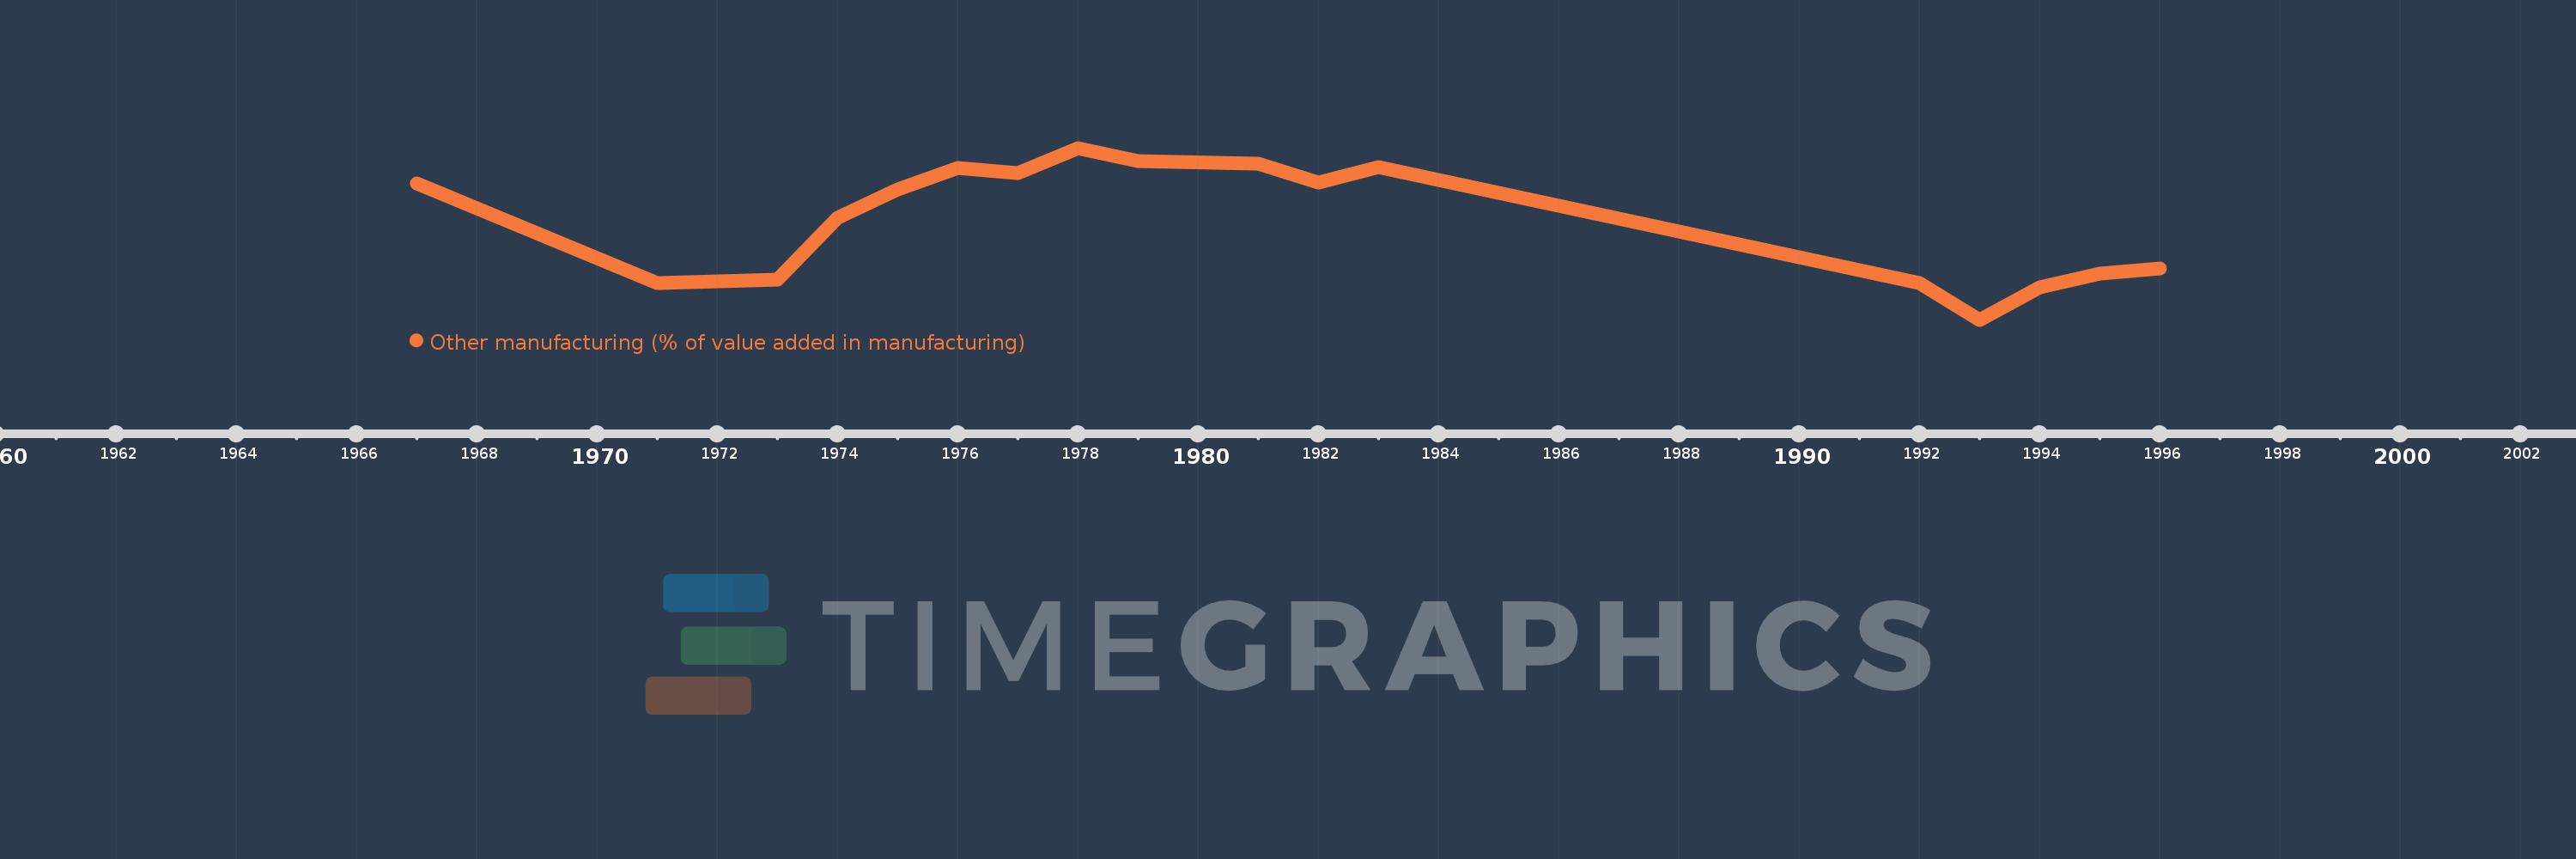
Questa scala temporale mostra un grafico dal 1967 anno al 1996 anno. Gabon. I dati fino ad 1966 anno non disponibili. Il numero di osservazioni attuali secondo i date: 17.
La fonte (nome):
Indicatori dello sviluppo mondiale
La fonte (organizzazione):
United Nations Industrial Development Organization, International Yearbook of Industrial Statistics.
Categorie:
Economy & Growth
sono stati aggiornati
23 apr 2017 anni
Indicatori delle variazioni dei valori per anni
In media:
54.371
Minima:
41.769
1 gen 1993 anni
Massimo:
63.58
1 gen 1978 anni
Alla data di osservazione
Valore
Variazione assoluta
La variazione rispetto al valore precedente
1 gen 1967 anni
59.054
+59.054
0.0%
1 gen 1971 anni
46.387
-12.667
-21.45%
1 gen 1973 anni
46.882
+0.495
1.07%
1 gen 1974 anni
54.709
+7.827
16.69%
1 gen 1975 anni
58.287
+3.578
6.54%
1 gen 1976 anni
61.033
+2.747
4.71%
1 gen 1977 anni
60.434
-0.6
-0.98%
1 gen 1978 anni
63.58
+3.146
5.21%
1 gen 1979 anni
61.928
-1.652
-2.6%
1 gen 1981 anni
61.627
-0.301
-0.49%
1 gen 1982 anni
59.216
-2.411
-3.91%
1 gen 1983 anni
61.169
+1.953
3.3%
1 gen 1992 anni
46.425
-14.744
-24.1%
1 gen 1993 anni
41.769
-4.656
-10.03%
1 gen 1994 anni
45.931
+4.161
9.96%
1 gen 1995 anni
47.587
+1.656
3.61%
1 gen 1996 anni
48.291
+0.704
1.48%
Classificazione dei paesi secondo i statistiche attuali per anni