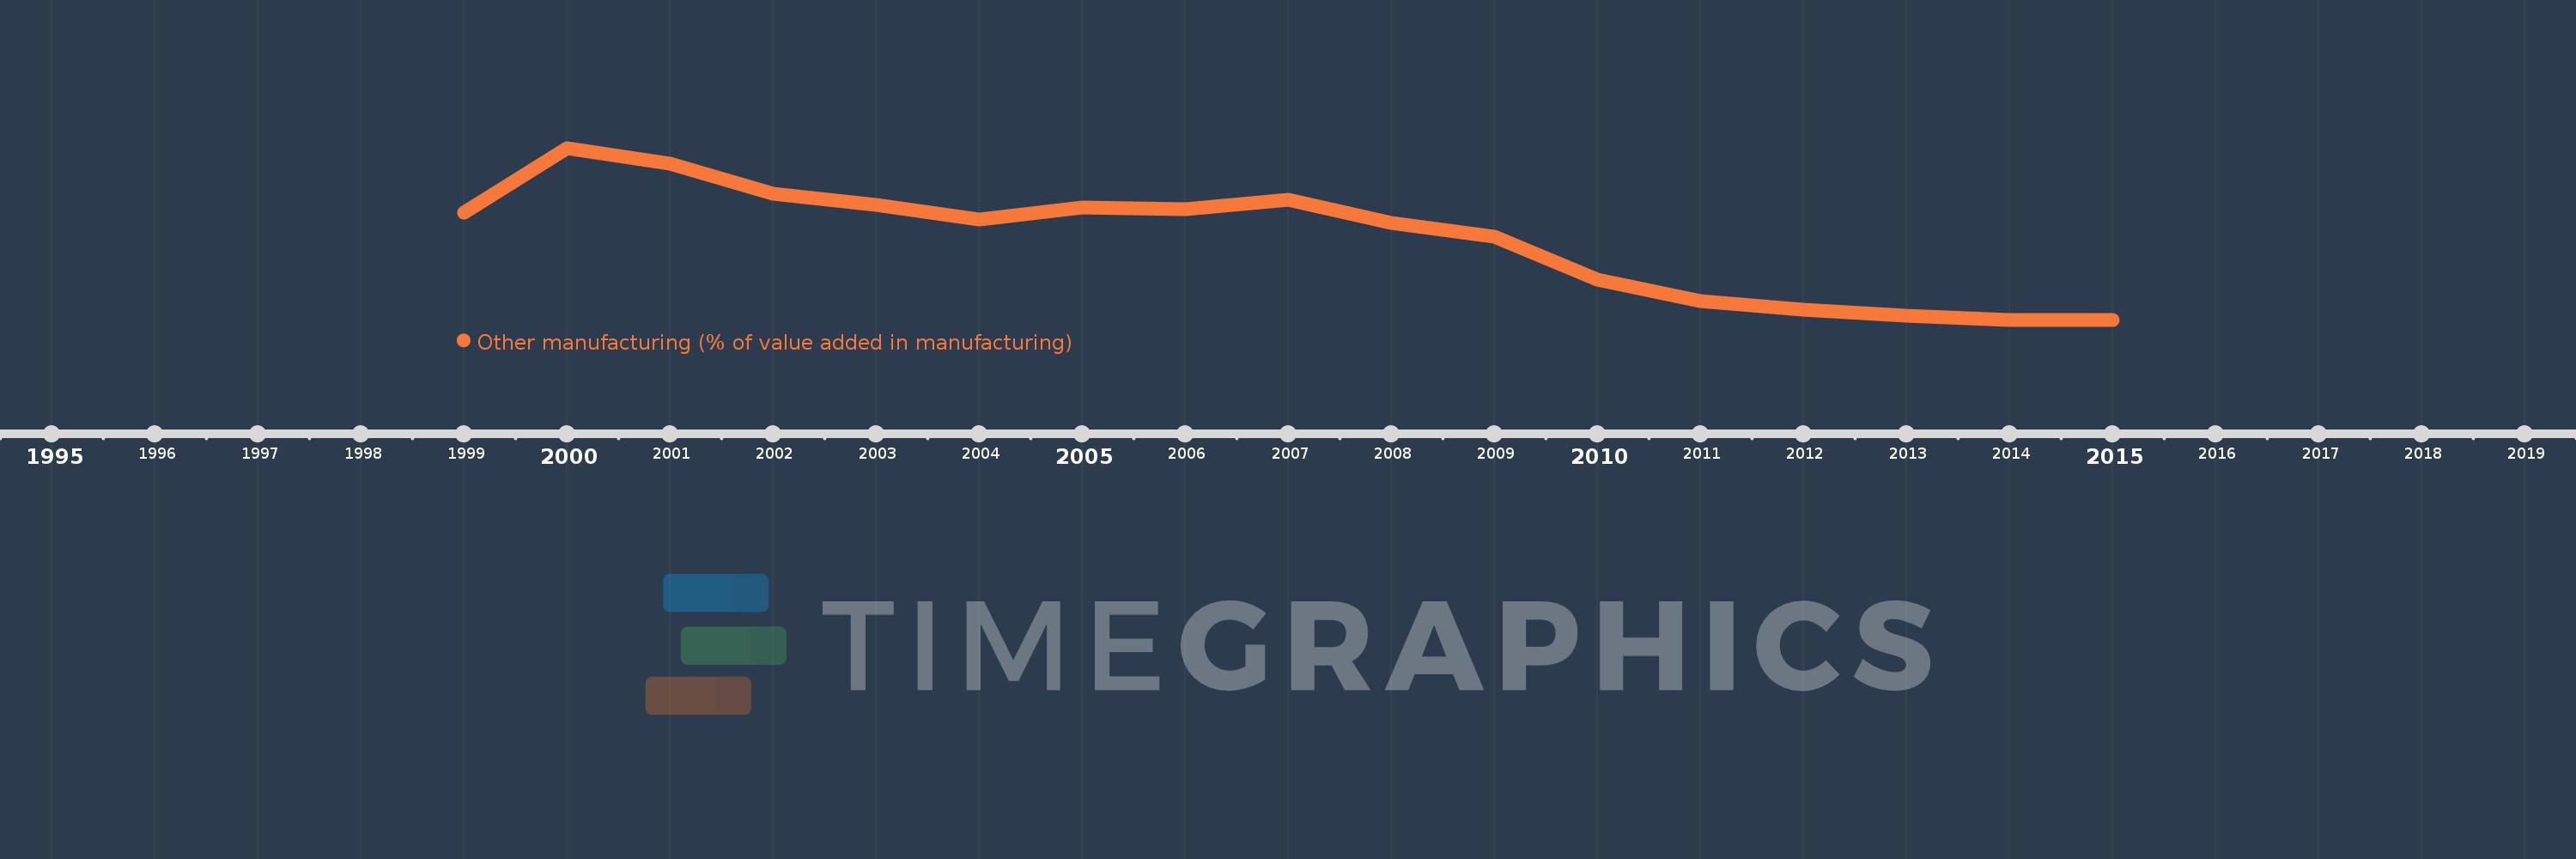
Questa scala temporale mostra un grafico dal 1999 anno al 2015 anno. Germany. I dati fino ad 1998 anno non disponibili. Il numero di osservazioni attuali secondo i date: 17.
La fonte (nome):
Indicatori dello sviluppo mondiale
La fonte (organizzazione):
United Nations Industrial Development Organization, International Yearbook of Industrial Statistics.
Categorie:
Economy & Growth
sono stati aggiornati
23 apr 2017 anni
Indicatori delle variazioni dei valori per anni
In media:
42.938
Minima:
38.466
1 gen 2014 anni
Massimo:
47.977
1 gen 2000 anni
Alla data di osservazione
Valore
Variazione assoluta
La variazione rispetto al valore precedente
1 gen 1999 anni
44.406
+44.406
0.0%
1 gen 2000 anni
47.977
+3.571
8.04%
1 gen 2001 anni
47.124
-0.852
-1.78%
1 gen 2002 anni
45.463
-1.661
-3.52%
1 gen 2003 anni
44.836
-0.627
-1.38%
1 gen 2004 anni
44.032
-0.804
-1.79%
1 gen 2005 anni
44.687
+0.655
1.49%
1 gen 2006 anni
44.595
-0.092
-0.21%
1 gen 2007 anni
45.1
+0.504
1.13%
1 gen 2008 anni
43.821
-1.279
-2.84%
1 gen 2009 anni
43.066
-0.755
-1.72%
1 gen 2010 anni
40.674
-2.393
-5.56%
1 gen 2011 anni
39.515
-1.159
-2.85%
1 gen 2012 anni
39.013
-0.502
-1.27%
1 gen 2013 anni
38.709
-0.304
-0.78%
1 gen 2014 anni
38.466
-0.243
-0.63%
1 gen 2015 anni
38.466
+0.0
0.0%
Classificazione dei paesi secondo i statistiche attuali per anni